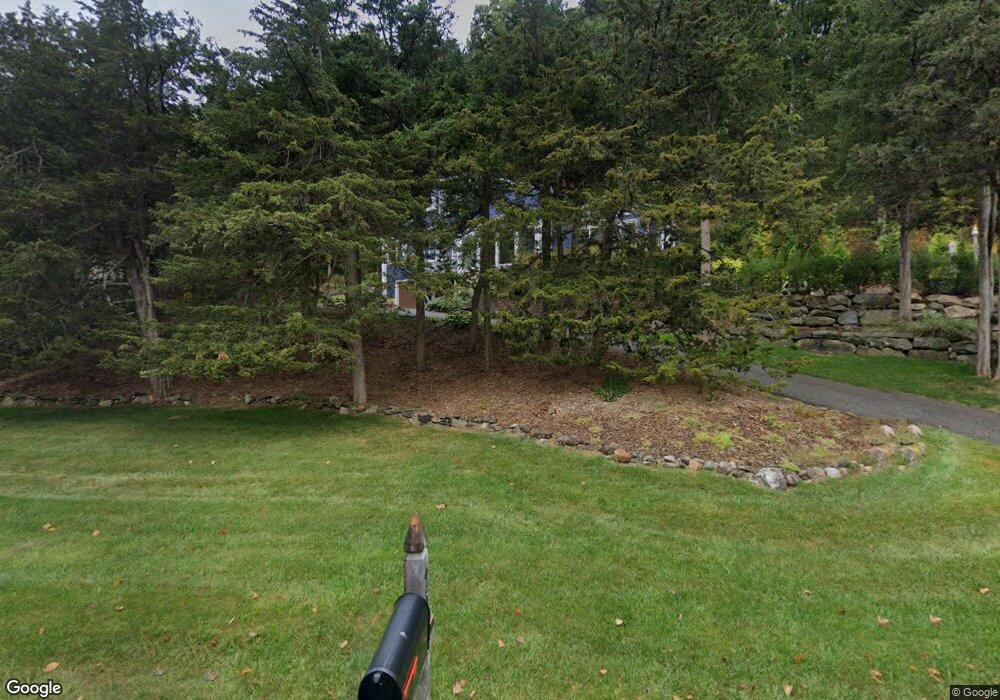
26 Deerfield Trace Burlington, CT 06013
Estimated Value: $534,000 - $677,000
3
Beds
2
Baths
2,100
Sq Ft
$277/Sq Ft
Est. Value
About This Home
This home is located at 26 Deerfield Trace, Burlington, CT 06013 and is currently estimated at $580,902, approximately $276 per square foot. 26 Deerfield Trace is a home located in Hartford County with nearby schools including Lake Garda Elementary School, Har-Bur Middle School, and Lewis S. Mills High School.
Ownership History
Date
Name
Owned For
Owner Type
Purchase Details
Closed on
Mar 14, 2011
Sold by
Celadon John L
Bought by
Archambault Stacey D and Kennedy Robert E
Current Estimated Value
Home Financials for this Owner
Home Financials are based on the most recent Mortgage that was taken out on this home.
Original Mortgage
$268,000
Interest Rate
4.83%
Purchase Details
Closed on
Oct 31, 2007
Sold by
Michael T Shaw Lt and Shaw Michael T
Bought by
Celadon John L and Biget Gregory C
Purchase Details
Closed on
Jan 16, 1998
Sold by
Donnellan Nanci
Bought by
Shaw Michael T
Purchase Details
Closed on
Jun 21, 1994
Sold by
Martin Hugh F and Martin Susan A
Bought by
Dunnellan Nanci
Create a Home Valuation Report for This Property
The Home Valuation Report is an in-depth analysis detailing your home's value as well as a comparison with similar homes in the area
Home Values in the Area
Average Home Value in this Area
Purchase History
| Date | Buyer | Sale Price | Title Company |
|---|---|---|---|
| Archambault Stacey D | $335,000 | -- | |
| Archambault Stacey D | $335,000 | -- | |
| Celadon John L | $345,000 | -- | |
| Celadon John L | $345,000 | -- | |
| Shaw Michael T | $205,000 | -- | |
| Shaw Michael T | $205,000 | -- | |
| Dunnellan Nanci | $185,000 | -- | |
| Dunnellan Nanci | $185,000 | -- |
Source: Public Records
Mortgage History
| Date | Status | Borrower | Loan Amount |
|---|---|---|---|
| Open | Dunnellan Nanci | $262,500 | |
| Closed | Dunnellan Nanci | $268,000 |
Source: Public Records
Tax History
| Year | Tax Paid | Tax Assessment Tax Assessment Total Assessment is a certain percentage of the fair market value that is determined by local assessors to be the total taxable value of land and additions on the property. | Land | Improvement |
|---|---|---|---|---|
| 2025 | $8,923 | $335,440 | $76,370 | $259,070 |
| 2024 | $8,688 | $335,440 | $76,370 | $259,070 |
| 2023 | $7,824 | $242,970 | $84,980 | $157,990 |
| 2022 | $7,945 | $242,970 | $84,980 | $157,990 |
| 2021 | $8,115 | $242,970 | $84,980 | $157,990 |
| 2020 | $8,091 | $242,970 | $84,980 | $157,990 |
| 2019 | $8,018 | $242,970 | $84,980 | $157,990 |
| 2018 | $6,934 | $213,360 | $84,980 | $128,380 |
| 2017 | $6,828 | $213,360 | $84,980 | $128,380 |
| 2016 | $6,742 | $213,360 | $84,980 | $128,380 |
| 2015 | $6,635 | $213,360 | $84,980 | $128,380 |
| 2014 | $6,369 | $213,360 | $84,980 | $128,380 |
Source: Public Records
Map
Nearby Homes
- 36 Barnes Hill Rd
- 25 Punch Brook Rd
- 114 Daniel Trace
- 9A Alice Dr
- 0 Spielman Hwy
- 28 Sepous Rd
- 26 Berkshire Crossing
- 5 W Woods Rd
- 25 Fenwick Dr
- 2 Ventres Way
- 767 George Washington Turnpike
- 361D George Washington Turnpike
- Map Block # 1-04-8 ( George Washington Turnpike
- Lots 1-3 Verville Rd
- 358 George Washington Turnpike
- 373 Collinsville Rd
- 51 Westland Rd
- 39 High Ridge Hollow
- 64 Bridge St
- 138 Northington Dr
- 22 Deerfield Trace
- 30 Deerfield Trace
- 27 Deerfield Trace
- 23 Deerfield Trace
- 21 Deerfield Trace
- 33 Fawn Hill Rd
- 31 Deerfield Trace
- 18 Deerfield Trace
- 17 Deerfield Trace
- 38 Fawn Hill Rd
- 34 Deerfield Trace
- 34 Fawn Hill Rd
- 16 Deerfield Trace
- 15 Deerfield Trace
- 35 Deerfield Trace
- 12 Deerfield Trace
- 12 Doe Meadow Ln
- 19 Summit Dr
- 27 Fawn Hill Rd
- 8 Doe Meadow Ln
Your Personal Tour Guide
Ask me questions while you tour the home.