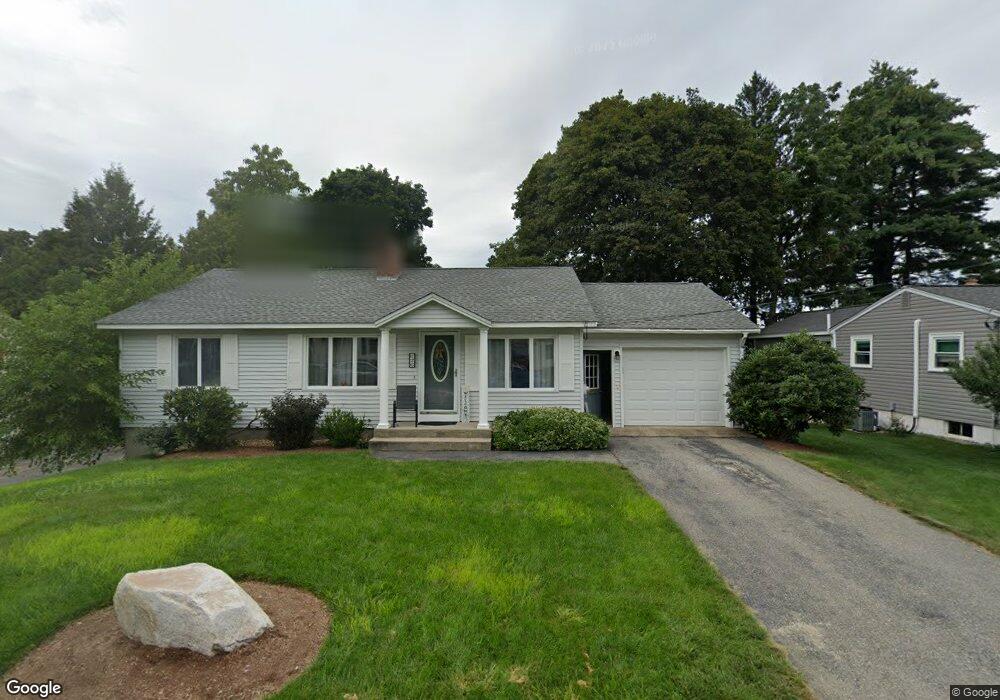
26 Dickerman St Nashua, NH 03060
Southeast Nashua NeighborhoodEstimated Value: $466,000 - $538,000
About This Home
This home is located at 26 Dickerman St, Nashua, NH 03060 and is currently estimated at $504,688, approximately $442 per square foot. 26 Dickerman St is a home located in Hillsborough County with nearby schools including Sunset Heights Elementary School, Elm Street Middle School, and Nashua High School North.
Ownership History
We collect this data history from publicly available records. To have your information removed, we recommend requesting removal directly through your county’s website.
Purchase Details
Home Financials for this Owner
Home Financials are based on the most recent Mortgage that was taken out on this home.Home Values in the Area
Average Home Value in this Area
Purchase History
We collect this data history from publicly available records. To have your information removed, we recommend requesting removal directly through your county’s website.
| Date | Buyer | Sale Price | Title Company |
|---|---|---|---|
| $127,900 | -- |
Mortgage History
We collect this data history from publicly available records. To have your information removed, we recommend requesting removal directly through your county’s website.
| Date | Status | Borrower | Loan Amount |
|---|---|---|---|
| Open | $136,000 | ||
| Closed | $127,900 |
Tax History
We collect this data history from publicly available records. To have your information removed, we recommend requesting removal directly through your county’s website.
| Year | Tax Paid | Tax Assessment Tax Assessment Total Assessment is a certain percentage of the fair market value that is determined by local assessors to be the total taxable value of land and additions on the property. | Land | Improvement |
|---|---|---|---|---|
| 2025 | $7,594 | $451,200 | $156,900 | $294,300 |
| 2024 | $7,174 | $451,200 | $156,900 | $294,300 |
| 2023 | $6,933 | $380,300 | $125,500 | $254,800 |
| 2022 | $6,872 | $380,300 | $125,500 | $254,800 |
| 2021 | $6,325 | $272,400 | $87,900 | $184,500 |
| 2020 | $6,159 | $272,400 | $87,900 | $184,500 |
| 2019 | $5,927 | $272,400 | $87,900 | $184,500 |
| 2018 | $5,778 | $272,400 | $87,900 | $184,500 |
| 2017 | $5,444 | $211,100 | $71,400 | $139,700 |
| 2016 | $5,292 | $211,100 | $71,400 | $139,700 |
| 2015 | $5,178 | $211,100 | $71,400 | $139,700 |
| 2014 | $5,077 | $211,100 | $71,400 | $139,700 |
Map
- 18 Fifield St
- 20 Lawndale Ave
- 14 Wentworth St
- 85 Taylor St
- 12 Burnett St Unit 115116
- 27 Eastman St Unit 6062
- 14 Charlton Cir
- 21 Hayden St
- 134 Ash St
- 21 Acton St Unit 45
- 66 Harbor Ave Unit 4
- 68 Robinson Rd
- 51 Nagle St
- 50 Spindlewick Dr
- 2 Farmington Rd
- 46 Marshall St
- 33 Ross St
- 39 Lovewell St
- 74 Linwood St
- 47 Farmington Rd
- 10 Montgomery Ave
- 12 Montgomery Ave Unit 70
- 6 Montgomery Ave
- 11 Montgomery Ave Unit 11
- 9-11 Montgomery Ave
- 13 Montgomery Ave Unit 54
- 9 Montgomery Ave Unit 11
- 14 Montgomery Ave Unit 107
- 15 Montgomery Ave Unit 5657
- 9 Winwood Ave
- 7 Montgomery Ave
- 9 Winnwood St
- 16 Montgomery Ave Unit 4950
- 5 Montgomery Ave
- 10 Dickerman St
- 23 Montgomery Ave
- 7 Winwood Ave
- 24 Dickerman St Unit 8688
- 12 Dickerman St Unit 14
- 7 Winwood Ave
Ask me questions while you tour the home.