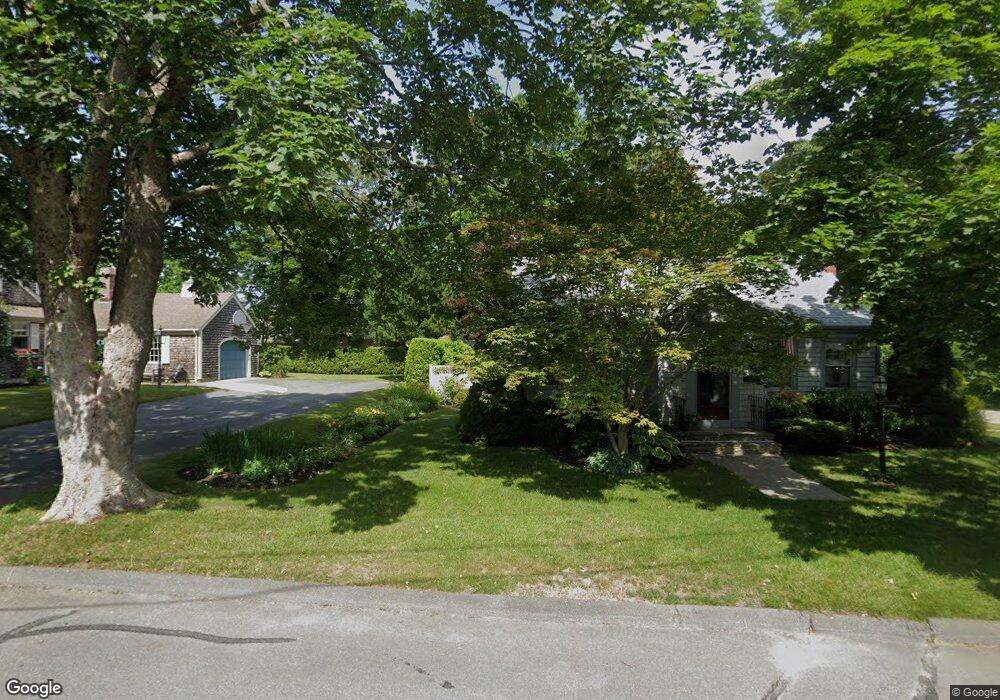
26 Doane St Fairhaven, MA 02719
Estimated Value: $618,000 - $752,000
3
Beds
2
Baths
1,540
Sq Ft
$438/Sq Ft
Est. Value
About This Home
This home is located at 26 Doane St, Fairhaven, MA 02719 and is currently estimated at $674,534, approximately $438 per square foot. 26 Doane St is a home located in Bristol County with nearby schools including Fairhaven High School, City On A Hill Charter Public School New Bedford, and St. Joseph School.
Ownership History
Date
Name
Owned For
Owner Type
Purchase Details
Closed on
Apr 29, 2011
Sold by
Martin N Brooks and Martin Sally V
Bought by
Martin Ft
Current Estimated Value
Purchase Details
Closed on
Mar 31, 2006
Sold by
Sher Carol
Bought by
Martin N Brooks and Martin Sally
Purchase Details
Closed on
Jan 28, 2004
Sold by
Pierce Carol Sher and Pierce Jeffrey B
Bought by
Sher Carol
Create a Home Valuation Report for This Property
The Home Valuation Report is an in-depth analysis detailing your home's value as well as a comparison with similar homes in the area
Home Values in the Area
Average Home Value in this Area
Purchase History
| Date | Buyer | Sale Price | Title Company |
|---|---|---|---|
| Martin Ft | -- | -- | |
| Martin N Brooks | $445,000 | -- | |
| Sher Carol | -- | -- |
Source: Public Records
Mortgage History
| Date | Status | Borrower | Loan Amount |
|---|---|---|---|
| Previous Owner | Sher Carol | $165,000 | |
| Previous Owner | Sher Carol | $73,000 | |
| Previous Owner | Sher Carol | $73,000 |
Source: Public Records
Tax History
| Year | Tax Paid | Tax Assessment Tax Assessment Total Assessment is a certain percentage of the fair market value that is determined by local assessors to be the total taxable value of land and additions on the property. | Land | Improvement |
|---|---|---|---|---|
| 2025 | $53 | $569,100 | $252,600 | $316,500 |
| 2024 | $4,962 | $537,600 | $252,600 | $285,000 |
| 2023 | $4,804 | $482,800 | $217,900 | $264,900 |
| 2022 | $4,527 | $443,000 | $198,500 | $244,500 |
| 2021 | $4,446 | $393,800 | $180,500 | $213,300 |
| 2020 | $7,212 | $390,700 | $180,500 | $210,200 |
| 2019 | $4,212 | $360,900 | $154,700 | $206,200 |
| 2018 | $4,061 | $345,600 | $147,200 | $198,400 |
| 2017 | $4,080 | $338,900 | $141,600 | $197,300 |
| 2016 | $3,994 | $327,900 | $138,900 | $189,000 |
| 2015 | $3,921 | $322,700 | $138,900 | $183,800 |
Source: Public Records
Map
Nearby Homes
- 32 Cedar St
- 32 Green St
- 2 Washburn Ave
- 11 Lawton St
- 24 Middle St
- 58 Washington St
- 0 Nulands Neck Unit 73286360
- 8 Washington St
- 145 Pleasant St
- 8 Manor Dr
- 58 Bayview Ave
- 27 Bayview Ave
- 77 Adams St
- 39 Christian St
- 181 Washington St
- 15 Bayview Ave
- 67 Bridge St
- 9 Abbott St
- 9 Cleveland St
- 138 Main St Unit 13
Your Personal Tour Guide
Ask me questions while you tour the home.