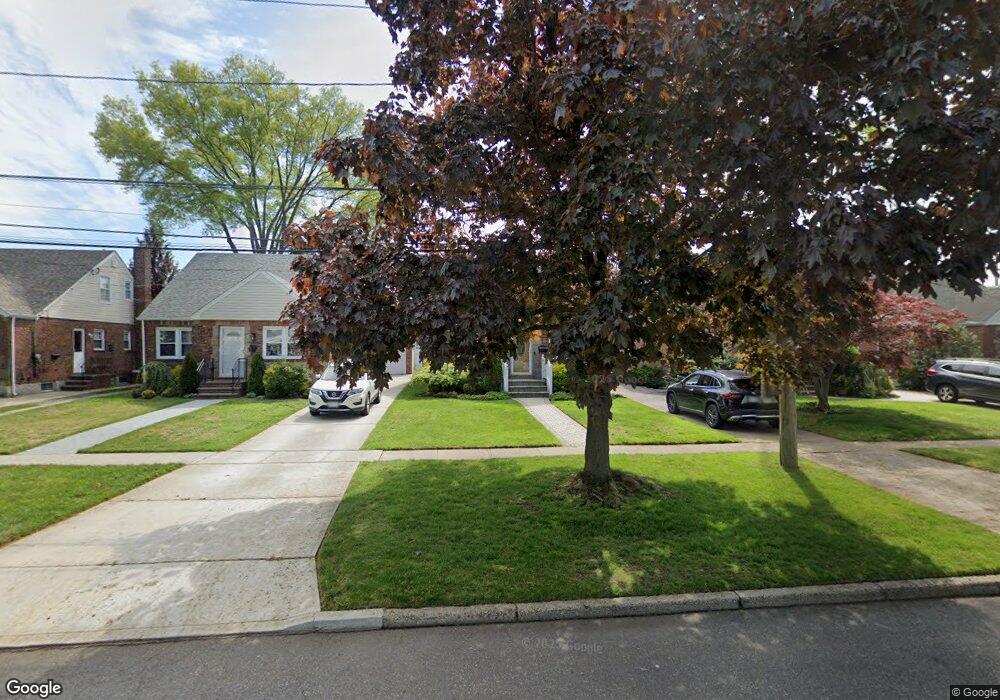
26 Dover Pkwy N Garden City, NY 11530
Estimated Value: $668,399 - $855,000
--
Bed
1
Bath
1,333
Sq Ft
$571/Sq Ft
Est. Value
About This Home
This home is located at 26 Dover Pkwy N, Garden City, NY 11530 and is currently estimated at $761,700, approximately $571 per square foot. 26 Dover Pkwy N is a home located in Nassau County with nearby schools including St Anne's School.
Ownership History
Date
Name
Owned For
Owner Type
Purchase Details
Closed on
Jul 29, 2024
Sold by
Lynch Susan
Bought by
Lynch Susan M and The Susan M Lynch Living Trust
Current Estimated Value
Purchase Details
Closed on
Feb 9, 2000
Sold by
Frank Eleanor K
Bought by
Lynch Susan
Home Financials for this Owner
Home Financials are based on the most recent Mortgage that was taken out on this home.
Original Mortgage
$185,000
Outstanding Balance
$60,149
Interest Rate
8.15%
Mortgage Type
Purchase Money Mortgage
Estimated Equity
$701,551
Create a Home Valuation Report for This Property
The Home Valuation Report is an in-depth analysis detailing your home's value as well as a comparison with similar homes in the area
Home Values in the Area
Average Home Value in this Area
Purchase History
| Date | Buyer | Sale Price | Title Company |
|---|---|---|---|
| Lynch Susan M | -- | None Available | |
| Lynch Susan M | -- | None Available | |
| Lynch Susan M | -- | None Available | |
| Lynch Susan | $260,000 | -- | |
| Lynch Susan | $260,000 | -- | |
| Lynch Susan | $260,000 | -- | |
| Lynch Susan | $260,000 | -- | |
| Lynch Susan | $260,000 | -- |
Source: Public Records
Mortgage History
| Date | Status | Borrower | Loan Amount |
|---|---|---|---|
| Open | Lynch Susan | $185,000 | |
| Closed | Lynch Susan | $185,000 |
Source: Public Records
Tax History Compared to Growth
Tax History
| Year | Tax Paid | Tax Assessment Tax Assessment Total Assessment is a certain percentage of the fair market value that is determined by local assessors to be the total taxable value of land and additions on the property. | Land | Improvement |
|---|---|---|---|---|
| 2025 | $8,654 | $449 | $205 | $244 |
| 2024 | $1,701 | $461 | $211 | $250 |
| 2023 | $7,422 | $497 | $228 | $269 |
| 2022 | $7,422 | $481 | $220 | $261 |
| 2021 | $6,055 | $490 | $222 | $268 |
| 2020 | $3,451 | $463 | $462 | $1 |
| 2019 | $5,129 | $496 | $486 | $10 |
| 2018 | $5,191 | $529 | $0 | $0 |
| 2017 | $4,187 | $562 | $489 | $73 |
| 2016 | $5,470 | $595 | $466 | $129 |
| 2015 | $1,407 | $628 | $492 | $136 |
| 2014 | $1,407 | $628 | $492 | $136 |
| 2013 | $1,378 | $661 | $518 | $143 |
Source: Public Records
Map
Nearby Homes