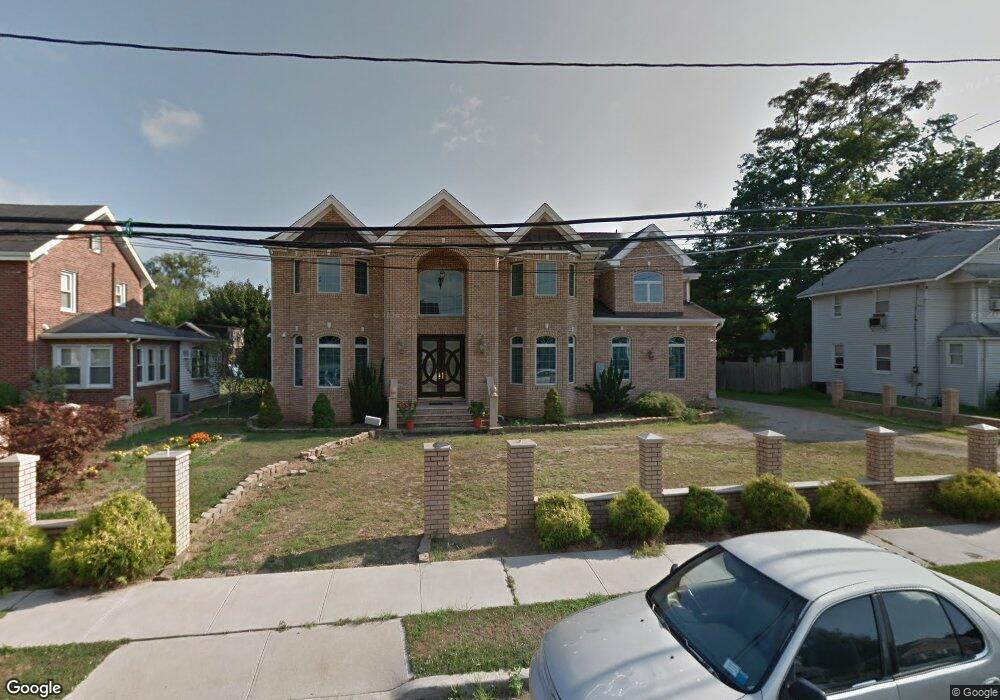
26 Duncan Place Oceanside, NY 11572
Estimated Value: $1,046,000
Studio
4
Baths
4,178
Sq Ft
$250/Sq Ft
Est. Value
About This Home
This home is located at 26 Duncan Place, Oceanside, NY 11572 and is currently estimated at $1,046,000, approximately $250 per square foot. 26 Duncan Place is a home located in Nassau County with nearby schools including North Oceanside Elementary School 5, Oceanside Middle School, and Oceanside High School.
Ownership History
Date
Name
Owned For
Owner Type
Purchase Details
Closed on
Jun 23, 2020
Sold by
Ramnauth Balmarita D
Bought by
Singh Bhupinderjit and Kumar Satwant
Current Estimated Value
Home Financials for this Owner
Home Financials are based on the most recent Mortgage that was taken out on this home.
Original Mortgage
$689,500
Outstanding Balance
$609,837
Interest Rate
3.2%
Mortgage Type
New Conventional
Estimated Equity
$436,163
Purchase Details
Closed on
Aug 11, 2017
Sold by
Ramnauth Balamrita D and Khemraj Clifford J
Bought by
Ramnauth Balamrita D
Purchase Details
Closed on
Nov 29, 2007
Sold by
Mank Ann
Bought by
Khemraj Bal
Purchase Details
Closed on
Jan 21, 1999
Sold by
Blake Linda J and Jewell Elizabeth M
Bought by
Blake Linda J and Mank Ann
Create a Home Valuation Report for This Property
The Home Valuation Report is an in-depth analysis detailing your home's value as well as a comparison with similar homes in the area
Home Values in the Area
Average Home Value in this Area
Purchase History
| Date | Buyer | Sale Price | Title Company |
|---|---|---|---|
| Singh Bhupinderjit | $985,000 | Fidelity National Title | |
| Singh Bhupinderjit | $985,000 | Fidelity National Title | |
| Singh Bhupinderjit | $985,000 | Fidelity National Title | |
| Ramnauth Balamrita D | -- | Omni Title Agency | |
| Ramnauth Balamrita D | -- | Omni Title Agency | |
| Ramnauth Balamrita D | -- | Omni Title Agency | |
| Khemraj Bal | $430,000 | -- | |
| Khemraj Bal | $430,000 | -- | |
| Blake Linda J | -- | -- | |
| Blake Linda J | -- | -- | |
| Blake Linda J | -- | -- | |
| Blake Linda J | -- | -- | |
| Blake Linda J | -- | -- |
Source: Public Records
Mortgage History
| Date | Status | Borrower | Loan Amount |
|---|---|---|---|
| Open | Singh Bhupinderjit | $689,500 | |
| Closed | Singh Bhupinderjit | $689,500 |
Source: Public Records
Tax History
| Year | Tax Paid | Tax Assessment Tax Assessment Total Assessment is a certain percentage of the fair market value that is determined by local assessors to be the total taxable value of land and additions on the property. | Land | Improvement |
|---|---|---|---|---|
| 2025 | $26,841 | $972 | $325 | $647 |
| 2024 | $7,232 | $925 | $325 | $600 |
Source: Public Records
Map
Nearby Homes
- 2752 Academy St
- 2585 Oceanside Rd
- 14 Tilrose Ave
- 2861 Tilrose Ave
- 197 Foxhurst Rd
- 42 Homecrest Ct
- 2539 Washington Ave
- 138 Davison Ave
- 254 Elizabeth Ave
- 2469 Washington Ave
- 2900 Stevens St
- 226 Oakview Ave
- 21 Bellevue Ave
- 4 S Forest Ave Unit B
- 2860 Nicole Ct
- 2926 Davis St
- 15 N Oceanside Rd
- 400 Merrick Rd Unit 5A
- 17 Roxbury Rd
- 2860 Lenox Rd
- 34 Duncan Place
- 18 Duncan Place
- 2638 Locust Ave
- 2650 Locust Ave
- 25 Duncan Place
- 12 Duncan Place
- 23 Duncan Place
- 33 Duncan Place
- 2656 Locust Ave
- 17 Duncan Place
- 2647 Long Beach Rd
- 2647 Long Beach Rd Unit 1
- 43 Duncan Place
- 0 Locust Ave
- 11 Duncan Place
- 2664 Locust Ave
- 24 Franklin Place
- 18 Franklin Place
- 30 Franklin Place
- 1 Duncan Place
Your Personal Tour Guide
Ask me questions while you tour the home.