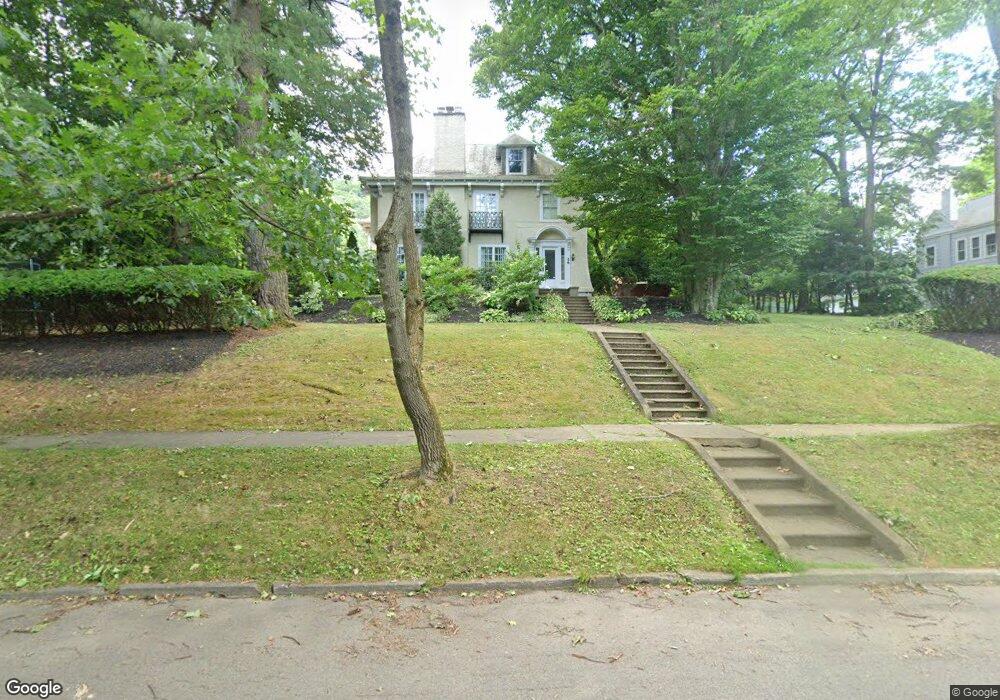
26 E 5th St Corning, NY 14830
Estimated Value: $480,028 - $599,000
4
Beds
6
Baths
4,200
Sq Ft
$128/Sq Ft
Est. Value
About This Home
This home is located at 26 E 5th St, Corning, NY 14830 and is currently estimated at $538,257, approximately $128 per square foot. 26 E 5th St is a home located in Steuben County with nearby schools including Frederick Carder Elementary School, Corning-Painted Post Middle School, and Corning-Painted Post High School.
Ownership History
Date
Name
Owned For
Owner Type
Purchase Details
Closed on
Sep 1, 2009
Sold by
Rust Graig E
Bought by
Hennessey James M
Current Estimated Value
Purchase Details
Closed on
May 12, 2003
Sold by
Cendant Mobility Financia L Corp
Bought by
Rust Craig E
Purchase Details
Closed on
Nov 6, 2002
Sold by
Frohlich Bert T
Bought by
Cendant Mobility Financial Corporation
Purchase Details
Closed on
Dec 29, 1999
Sold by
Lantigua Edward A and Lantigua Martha Maus
Bought by
Frohlich Bert T
Purchase Details
Closed on
May 22, 1997
Sold by
Yorio Ronald A and Yorio Jerry L
Bought by
Lantigua Edward A and Maus Martha
Create a Home Valuation Report for This Property
The Home Valuation Report is an in-depth analysis detailing your home's value as well as a comparison with similar homes in the area
Home Values in the Area
Average Home Value in this Area
Purchase History
| Date | Buyer | Sale Price | Title Company |
|---|---|---|---|
| Hennessey James M | $325,000 | John V Moore | |
| Rust Craig E | $220,000 | Steven E Agan | |
| Cendant Mobility Financial Corporation | $315,000 | Bruce Hofstetter | |
| Frohlich Bert T | $400,000 | George J Welch | |
| Lantigua Edward A | $320,000 | -- | |
| Lantigua Edward A | $320,000 | -- |
Source: Public Records
Tax History
| Year | Tax Paid | Tax Assessment Tax Assessment Total Assessment is a certain percentage of the fair market value that is determined by local assessors to be the total taxable value of land and additions on the property. | Land | Improvement |
|---|---|---|---|---|
| 2024 | $12,248 | $446,000 | $37,600 | $408,400 |
| 2023 | $12,383 | $446,000 | $37,600 | $408,400 |
| 2022 | $16,462 | $350,000 | $35,100 | $314,900 |
| 2021 | $12,109 | $350,000 | $35,100 | $314,900 |
| 2020 | $7,581 | $350,000 | $35,100 | $314,900 |
| 2019 | $15,609 | $350,000 | $35,100 | $314,900 |
| 2018 | $15,609 | $350,000 | $35,100 | $314,900 |
| 2017 | $11,558 | $350,000 | $35,100 | $314,900 |
| 2016 | $11,430 | $350,000 | $35,100 | $314,900 |
| 2015 | -- | $350,000 | $35,100 | $314,900 |
| 2014 | -- | $350,000 | $35,100 | $314,900 |
Source: Public Records
Map
Nearby Homes
Your Personal Tour Guide
Ask me questions while you tour the home.