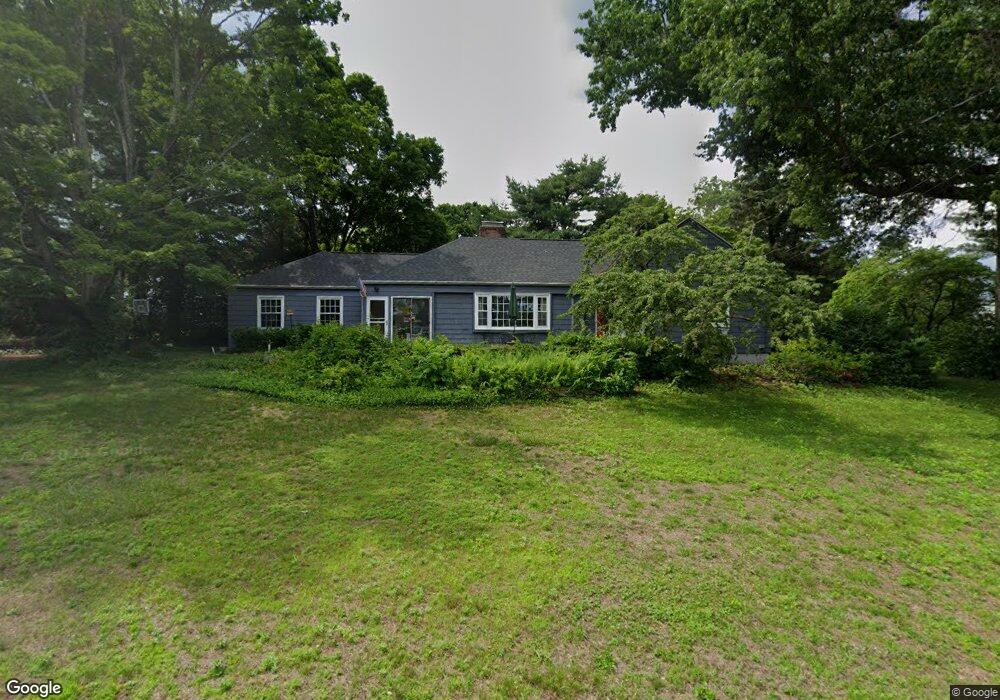
26 E Circle Dr East Longmeadow, MA 01028
Estimated Value: $383,177 - $449,000
3
Beds
2
Baths
1,480
Sq Ft
$278/Sq Ft
Est. Value
About This Home
This home is located at 26 E Circle Dr, East Longmeadow, MA 01028 and is currently estimated at $411,544, approximately $278 per square foot. 26 E Circle Dr is a home located in Hampden County with nearby schools including Meadowbrook Elementary School, Birchland Park Middle School, and East Longmeadow High School.
Ownership History
Date
Name
Owned For
Owner Type
Purchase Details
Closed on
Jun 25, 2004
Sold by
Ellison David C and Ellison Teresa L
Bought by
Ellison David C and Ellison Teresa L
Current Estimated Value
Purchase Details
Closed on
Nov 29, 1988
Sold by
Campbell Ruth E
Bought by
Ellison David C
Home Financials for this Owner
Home Financials are based on the most recent Mortgage that was taken out on this home.
Original Mortgage
$144,000
Interest Rate
10.21%
Mortgage Type
Purchase Money Mortgage
Create a Home Valuation Report for This Property
The Home Valuation Report is an in-depth analysis detailing your home's value as well as a comparison with similar homes in the area
Home Values in the Area
Average Home Value in this Area
Purchase History
| Date | Buyer | Sale Price | Title Company |
|---|---|---|---|
| Ellison David C | -- | -- | |
| Ellison David C | $160,000 | -- |
Source: Public Records
Mortgage History
| Date | Status | Borrower | Loan Amount |
|---|---|---|---|
| Previous Owner | Ellison David C | $144,000 |
Source: Public Records
Tax History
| Year | Tax Paid | Tax Assessment Tax Assessment Total Assessment is a certain percentage of the fair market value that is determined by local assessors to be the total taxable value of land and additions on the property. | Land | Improvement |
|---|---|---|---|---|
| 2025 | $6,248 | $338,100 | $145,200 | $192,900 |
| 2024 | $5,996 | $323,400 | $145,200 | $178,200 |
| 2023 | $5,633 | $293,400 | $130,900 | $162,500 |
| 2022 | $5,355 | $263,900 | $118,100 | $145,800 |
| 2021 | $5,248 | $249,200 | $109,500 | $139,700 |
| 2020 | $5,039 | $241,800 | $109,500 | $132,300 |
| 2019 | $4,827 | $234,900 | $106,200 | $128,700 |
| 2018 | $4,129 | $197,200 | $106,200 | $91,000 |
| 2017 | $4,013 | $193,200 | $103,900 | $89,300 |
| 2016 | $3,990 | $188,900 | $100,600 | $88,300 |
| 2015 | $3,914 | $188,900 | $100,600 | $88,300 |
Source: Public Records
Map
Nearby Homes
- 0 Apple Blossom Ln
- 15 Lynwood Rd
- 55 Allen St
- 1962 Allen St
- 25 Laurelwood Ln
- 101 Dearborn St
- 65 Helen Cir
- Lot 24 Happy Acres Ln
- Lot 8 Happy Acres Ln
- 132 Kibbe Rd
- 72 Tanglewood Dr
- Lot 21 Farmer Cir
- Lot 13 Farmer Cir
- 25 Winding Brook Ln
- 41 Hillside Dr
- 350 Parker St
- 111 Malibu Dr
- 16 Deerfoot Dr
- 26 High St
- 17 Skyridge Ln
Your Personal Tour Guide
Ask me questions while you tour the home.