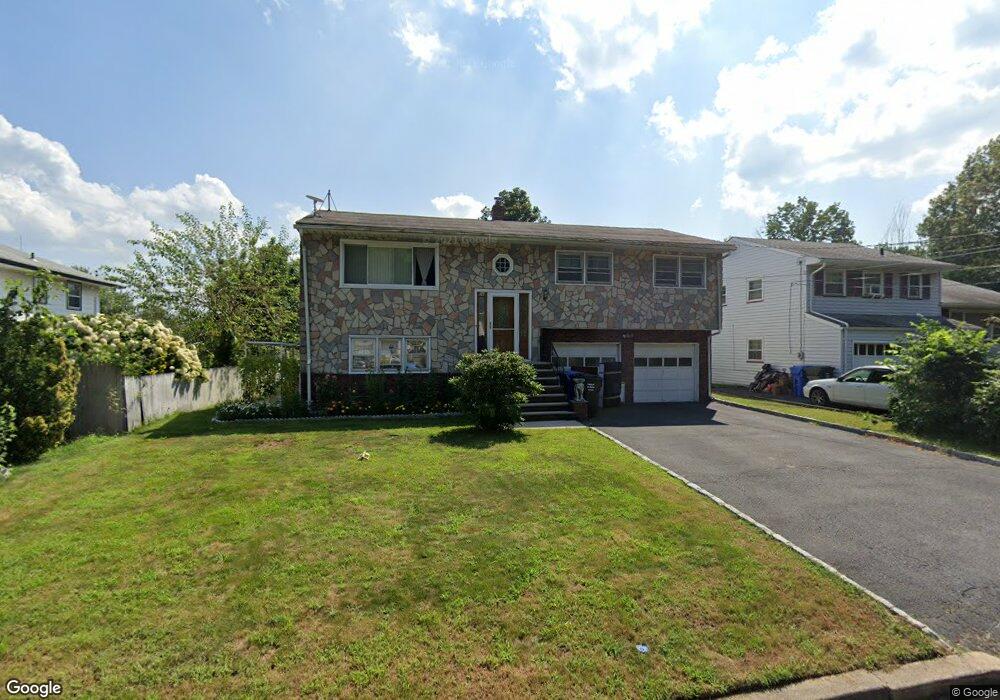
26 E Maple St Colonia, NJ 07067
Estimated Value: $434,334 - $621,000
3
Beds
3
Baths
1,232
Sq Ft
$439/Sq Ft
Est. Value
About This Home
This home is located at 26 E Maple St, Colonia, NJ 07067 and is currently estimated at $541,084, approximately $439 per square foot. 26 E Maple St is a home located in Middlesex County with nearby schools including Pennsylvania Ave School, Colonia Middle School, and Colonia High School.
Ownership History
Date
Name
Owned For
Owner Type
Purchase Details
Closed on
Apr 2, 2019
Sold by
Iyer Ramalingam and Iyer Saroja
Bought by
Fisco Jennifer
Current Estimated Value
Home Financials for this Owner
Home Financials are based on the most recent Mortgage that was taken out on this home.
Original Mortgage
$324,950
Outstanding Balance
$285,689
Interest Rate
4.3%
Mortgage Type
New Conventional
Estimated Equity
$255,395
Purchase Details
Closed on
Jul 23, 1992
Bought by
Iyer Ramalingam and Iyer Saroja
Create a Home Valuation Report for This Property
The Home Valuation Report is an in-depth analysis detailing your home's value as well as a comparison with similar homes in the area
Home Values in the Area
Average Home Value in this Area
Purchase History
| Date | Buyer | Sale Price | Title Company |
|---|---|---|---|
| Fisco Jennifer | $335,000 | Westcor Land Title Ins Co | |
| Iyer Ramalingam | $130,000 | -- |
Source: Public Records
Mortgage History
| Date | Status | Borrower | Loan Amount |
|---|---|---|---|
| Open | Fisco Jennifer | $324,950 |
Source: Public Records
Tax History
| Year | Tax Paid | Tax Assessment Tax Assessment Total Assessment is a certain percentage of the fair market value that is determined by local assessors to be the total taxable value of land and additions on the property. | Land | Improvement |
|---|---|---|---|---|
| 2025 | $10,140 | $83,800 | $22,000 | $61,800 |
| 2024 | $9,920 | $83,800 | $22,000 | $61,800 |
| 2023 | $9,920 | $83,800 | $22,000 | $61,800 |
| 2022 | $9,674 | $83,800 | $22,000 | $61,800 |
| 2021 | $9,594 | $83,800 | $22,000 | $61,800 |
| 2020 | $9,305 | $83,800 | $22,000 | $61,800 |
| 2019 | $9,085 | $83,800 | $22,000 | $61,800 |
| 2018 | $8,912 | $83,800 | $22,000 | $61,800 |
| 2017 | $8,755 | $83,800 | $22,000 | $61,800 |
| 2016 | $8,688 | $83,800 | $22,000 | $61,800 |
| 2015 | $8,535 | $83,800 | $22,000 | $61,800 |
| 2014 | $8,352 | $83,800 | $22,000 | $61,800 |
Source: Public Records
Map
Nearby Homes
- 15 E Walnut St
- 112 W Willow St
- 16 N Lincoln Ave
- 150 Carolyn Ave
- 116 Arthur Ave
- 24 Frederick Ave
- 18 Cherbar Ct
- 20 Alastair Place
- 2 Cherbar Ct
- 26 Linda Ave
- 11 Lyric Dr
- 20 Joanna Place
- 178 N Grant Ave
- 127 Dukes Rd
- 836 W Inman Ave
- 53 Jordan Rd
- 53 Princeton Ave
- 21 Windsor Ln
- 196 Russell Ave
- 69 Stanford Ave
Your Personal Tour Guide
Ask me questions while you tour the home.