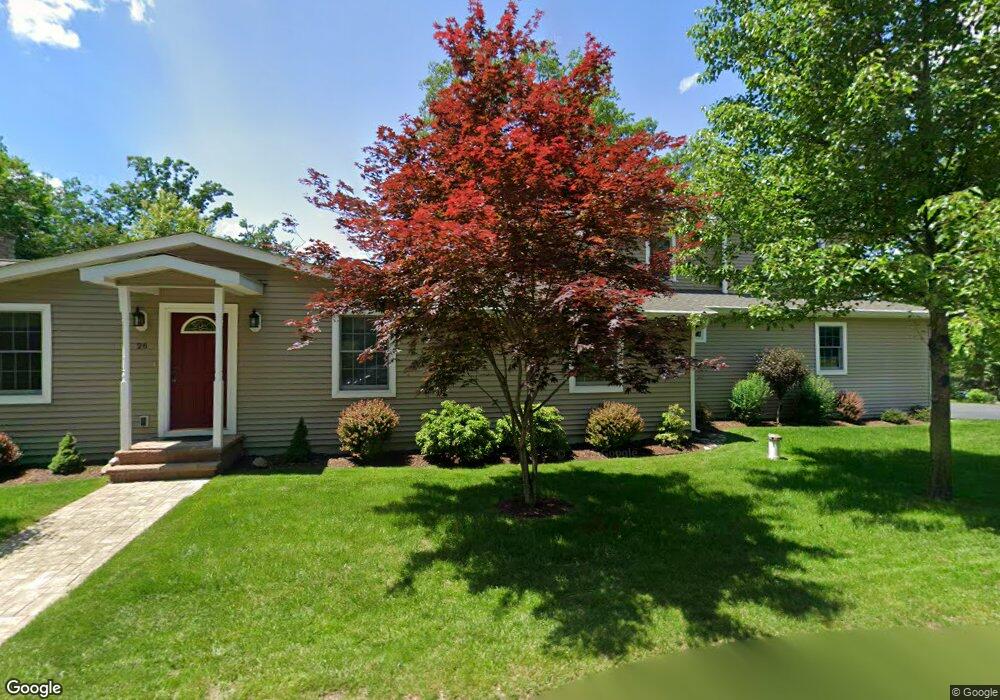
26 E Shore Dr Newton, NJ 07860
Estimated Value: $471,792 - $581,000
Studio
--
Bath
2,017
Sq Ft
$260/Sq Ft
Est. Value
About This Home
This home is located at 26 E Shore Dr, Newton, NJ 07860 and is currently estimated at $524,198, approximately $259 per square foot. 26 E Shore Dr is a home located in Sussex County with nearby schools including Marian E. McKeown School and Kittatinny Regional High School.
Ownership History
Date
Name
Owned For
Owner Type
Purchase Details
Closed on
Jul 30, 2025
Sold by
Sim Diane B
Bought by
Diane Sim Family Trust and Sim
Current Estimated Value
Purchase Details
Closed on
Feb 14, 2025
Sold by
Sim Peter M and Sim Diane B
Bought by
Sim Diane B
Purchase Details
Closed on
Nov 27, 2019
Sold by
Sim Peter M and Sim Diane B
Bought by
Sim Peter M and Sim Diane B
Purchase Details
Closed on
Feb 15, 2019
Sold by
Snyder Jeffrey and Snyder Ellen
Bought by
Sim Peter M and Sim Diane B
Home Financials for this Owner
Home Financials are based on the most recent Mortgage that was taken out on this home.
Original Mortgage
$87,000
Interest Rate
4.3%
Mortgage Type
New Conventional
Purchase Details
Closed on
Jan 14, 2009
Sold by
Sim Michael
Bought by
Sim Peter M and Sim Diane B
Home Financials for this Owner
Home Financials are based on the most recent Mortgage that was taken out on this home.
Original Mortgage
$120,000
Interest Rate
5.51%
Mortgage Type
Purchase Money Mortgage
Create a Home Valuation Report for This Property
The Home Valuation Report is an in-depth analysis detailing your home's value as well as a comparison with similar homes in the area
Home Values in the Area
Average Home Value in this Area
Purchase History
| Date | Buyer | Sale Price | Title Company |
|---|---|---|---|
| Diane Sim Family Trust | -- | None Listed On Document | |
| Sim Diane B | -- | None Listed On Document | |
| Sim Diane B | -- | None Listed On Document | |
| Sim Peter M | -- | None Available | |
| Sim Peter M | $77,500 | Old Republic Natl Ttl Ins Co | |
| Sim Peter M | $150,000 | None Available |
Source: Public Records
Mortgage History
| Date | Status | Borrower | Loan Amount |
|---|---|---|---|
| Previous Owner | Sim Peter M | $87,000 | |
| Previous Owner | Sim Peter M | $120,000 |
Source: Public Records
Tax History
| Year | Tax Paid | Tax Assessment Tax Assessment Total Assessment is a certain percentage of the fair market value that is determined by local assessors to be the total taxable value of land and additions on the property. | Land | Improvement |
|---|---|---|---|---|
| 2025 | $10,388 | $311,200 | $143,400 | $167,800 |
| 2024 | $9,837 | $311,200 | $143,400 | $167,800 |
Source: Public Records
Map
Nearby Homes
- 40 E Shore Dr
- 15 Copeley Rd
- 000 Pepperidge Dr
- 903 Aspen Ct
- 27 Plaza Dr
- 24 Plaza Dr
- 901 Chestnut Path
- 31 Kent Rd
- 68 W Shore Dr
- 121 W Shore Dr
- 90 Kemah Mecca Lake Rd
- 0 Mount Benevolence Rd
- 17 17 West Owassa Tnpk
- 239 E Shore Lake Owassa Rd
- 00 Plymouth Lake Dr
- 4 Grove St
- 40 Martin Ln
- 15 Ike Williams Rd
- 951 Owassa Rd
- 1071 County Road 521
Your Personal Tour Guide
Ask me questions while you tour the home.