Estimated Value: $721,000 - $924,000
About This Home
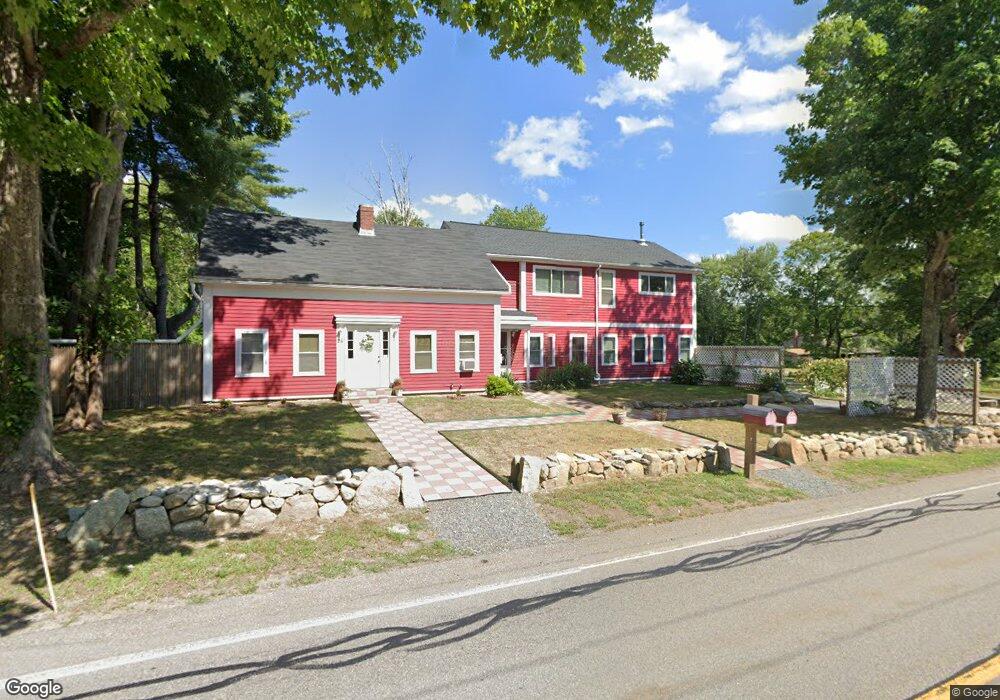
This home is located at 26 East St, Upton, MA 01568 and is currently estimated at $807,213, approximately $260 per square foot. 26 East St is a home located in Worcester County with nearby schools including Nipmuc Regional High School.
Ownership History
We collect this data history from publicly available records. To have your information removed, we recommend requesting removal directly through your county’s website.
Purchase Details
Home Financials for this Owner
Home Financials are based on the most recent Mortgage that was taken out on this home.Purchase Details
Home Values in the Area
Average Home Value in this Area
Purchase History
We collect this data history from publicly available records. To have your information removed, we recommend requesting removal directly through your county’s website.
| Date | Buyer | Sale Price | Title Company |
|---|---|---|---|
| $199,000 | -- | ||
| -- | -- | ||
| -- | -- |
Mortgage History
We collect this data history from publicly available records. To have your information removed, we recommend requesting removal directly through your county’s website.
| Date | Status | Borrower | Loan Amount |
|---|---|---|---|
| Open | $189,000 |
Tax History
We collect this data history from publicly available records. To have your information removed, we recommend requesting removal directly through your county’s website.
| Year | Tax Paid | Tax Assessment Tax Assessment Total Assessment is a certain percentage of the fair market value that is determined by local assessors to be the total taxable value of land and additions on the property. | Land | Improvement |
|---|---|---|---|---|
| 2025 | $7,127 | $542,000 | $259,400 | $282,600 |
| 2024 | $6,821 | $498,600 | $235,400 | $263,200 |
| 2023 | $6,057 | $436,700 | $195,400 | $241,300 |
| 2022 | $7,322 | $436,600 | $195,400 | $241,200 |
| 2021 | $6,939 | $418,000 | $197,000 | $221,000 |
| 2020 | $6,952 | $403,700 | $174,600 | $229,100 |
| 2019 | $6,955 | $401,800 | $166,600 | $235,200 |
| 2018 | $6,975 | $404,800 | $159,400 | $245,400 |
| 2017 | $4,896 | $269,600 | $148,200 | $121,400 |
| 2016 | $4,365 | $235,200 | $151,400 | $83,800 |
| 2015 | $4,205 | $248,100 | $151,400 | $96,700 |
| 2014 | $4,895 | $288,800 | $190,000 | $98,800 |
Map
- 24 East St
- 0 Lot 4 St E Unit 30274563
- 34 East St
- 22 East St
- 25 East St
- 12 Wood St Unit 109
- 48 East St
- 0 East St Unit 71066157
- 0 East St Unit 71347349
- 0 East St Unit 73072517
- 0 East St Unit 70685575
- 0 East St Unit 72869399
- 69 Walnut St
- 3 East St
- 0 Lot 5 St E Unit 30274572
- 50 East St
- 1 East St
- 49 East St
- 44 Rockwood Ln Unit 47
- 44 Rockwood Ln Unit 52
Ask me questions while you tour the home.