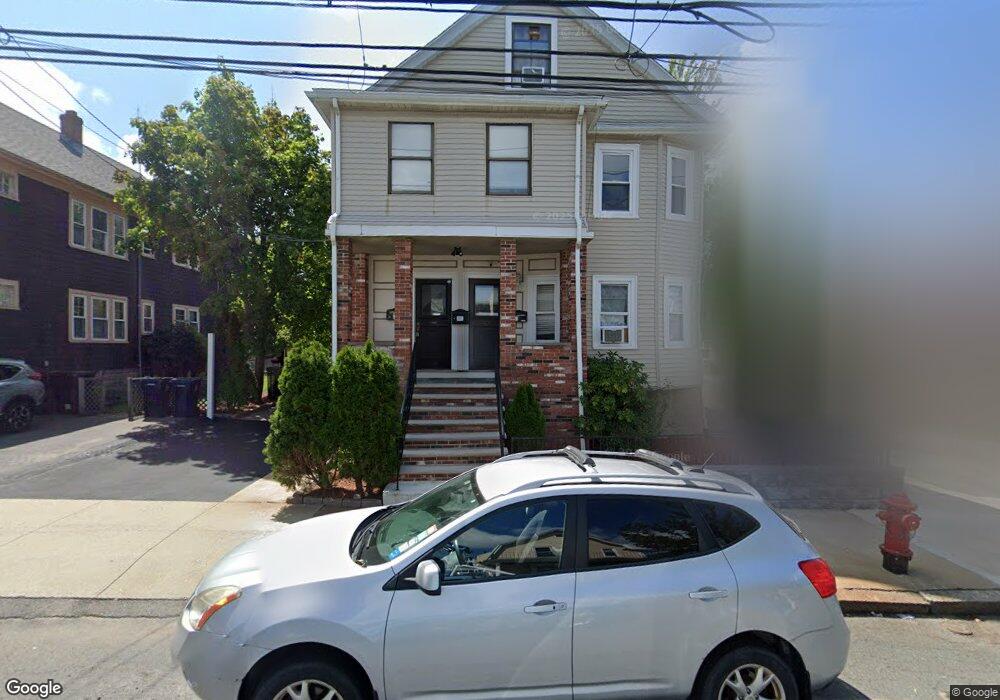
26 Edith St Everett, MA 02149
Glendale NeighborhoodEstimated Value: $974,000 - $1,038,000
5
Beds
4
Baths
2,775
Sq Ft
$363/Sq Ft
Est. Value
About This Home
This home is located at 26 Edith St, Everett, MA 02149 and is currently estimated at $1,007,310, approximately $362 per square foot. 26 Edith St is a home located in Middlesex County with nearby schools including Everett High School and Pioneer Charter School of Science.
Ownership History
Date
Name
Owned For
Owner Type
Purchase Details
Closed on
Jul 27, 2018
Sold by
Gaspar Aurino
Bought by
Gaspar Aurino
Current Estimated Value
Purchase Details
Closed on
Feb 4, 2005
Sold by
Gaspar Aurino
Bought by
Gaspar Aurino
Home Financials for this Owner
Home Financials are based on the most recent Mortgage that was taken out on this home.
Original Mortgage
$421,000
Interest Rate
5.77%
Mortgage Type
Purchase Money Mortgage
Purchase Details
Closed on
Mar 5, 1997
Sold by
Pinkney David W and Eismann Ruth E
Bought by
Barker Helen M
Create a Home Valuation Report for This Property
The Home Valuation Report is an in-depth analysis detailing your home's value as well as a comparison with similar homes in the area
Home Values in the Area
Average Home Value in this Area
Purchase History
| Date | Buyer | Sale Price | Title Company |
|---|---|---|---|
| Gaspar Aurino | -- | -- | |
| Gaspar Aurino | -- | -- | |
| Barker Helen M | $133,000 | -- |
Source: Public Records
Mortgage History
| Date | Status | Borrower | Loan Amount |
|---|---|---|---|
| Previous Owner | Gaspar Aurino | $421,000 |
Source: Public Records
Tax History Compared to Growth
Tax History
| Year | Tax Paid | Tax Assessment Tax Assessment Total Assessment is a certain percentage of the fair market value that is determined by local assessors to be the total taxable value of land and additions on the property. | Land | Improvement |
|---|---|---|---|---|
| 2025 | $10,682 | $937,800 | $254,900 | $682,900 |
| 2024 | $9,777 | $853,100 | $223,300 | $629,800 |
| 2023 | $9,541 | $809,900 | $213,600 | $596,300 |
| 2022 | $7,837 | $756,500 | $203,900 | $552,600 |
| 2021 | $7,053 | $714,600 | $182,500 | $532,100 |
| 2020 | $7,412 | $696,600 | $182,500 | $514,100 |
| 2019 | $7,824 | $632,000 | $173,800 | $458,200 |
| 2018 | $7,695 | $558,400 | $151,500 | $406,900 |
| 2017 | $7,304 | $505,800 | $135,900 | $369,900 |
| 2016 | $6,550 | $453,300 | $121,400 | $331,900 |
| 2015 | $6,073 | $415,700 | $109,500 | $306,200 |
Source: Public Records
Map
Nearby Homes
- 378 Ferry St
- 132 Vernal St
- 859 Broadway Unit 15
- 8 Parker St Unit 8
- 21 Hillside Ave Unit 21
- 21 Central Ave Unit 10
- 21 Staples Ave Unit 26
- 10 Clay Ave
- 20 Fairmount St
- 12 Holloway St
- 272-274 Cross St Unit 1
- 272-274 Cross St Unit 4
- 272-274 Cross St Unit 3
- 272-274 Cross St Unit 5
- 272-274 Cross St Unit 2
- 18 Lynn St
- 210 Hancock St
- 13-15 Benner Ave
- 40-42 Upham St Unit 1
- 112 Hadley St