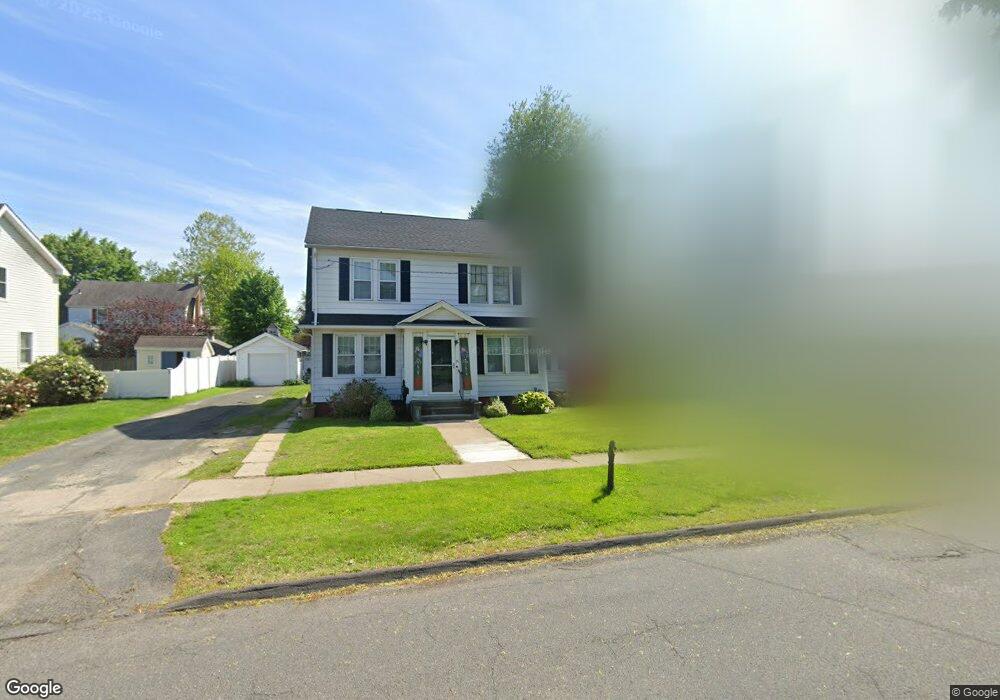
26 Edward St Agawam, MA 01001
Estimated Value: $305,000 - $334,000
4
Beds
1
Bath
1,376
Sq Ft
$230/Sq Ft
Est. Value
About This Home
This home is located at 26 Edward St, Agawam, MA 01001 and is currently estimated at $316,437, approximately $229 per square foot. 26 Edward St is a home located in Hampden County with nearby schools including Agawam Junior High School, Agawam High School, and St Thomas The Apostle School.
Ownership History
Date
Name
Owned For
Owner Type
Purchase Details
Closed on
Jul 7, 2006
Sold by
Rheault Brian D
Bought by
Rheault April L and Rheault Brian D
Current Estimated Value
Purchase Details
Closed on
Oct 3, 1994
Sold by
Waterbury Nellie F and Teahan John J
Bought by
Rheault Brian D and Rheault April L
Home Financials for this Owner
Home Financials are based on the most recent Mortgage that was taken out on this home.
Original Mortgage
$96,950
Interest Rate
8.5%
Mortgage Type
Purchase Money Mortgage
Create a Home Valuation Report for This Property
The Home Valuation Report is an in-depth analysis detailing your home's value as well as a comparison with similar homes in the area
Home Values in the Area
Average Home Value in this Area
Purchase History
| Date | Buyer | Sale Price | Title Company |
|---|---|---|---|
| Rheault April L | -- | -- | |
| Rheault Brian D | -- | -- | |
| Rheault Brian D | $75,000 | -- | |
| Rheault April L | -- | -- | |
| Rheault Brian D | $75,000 | -- |
Source: Public Records
Mortgage History
| Date | Status | Borrower | Loan Amount |
|---|---|---|---|
| Previous Owner | Rheault Brian D | $86,258 | |
| Previous Owner | Rheault Brian D | $96,950 |
Source: Public Records
Tax History Compared to Growth
Tax History
| Year | Tax Paid | Tax Assessment Tax Assessment Total Assessment is a certain percentage of the fair market value that is determined by local assessors to be the total taxable value of land and additions on the property. | Land | Improvement |
|---|---|---|---|---|
| 2025 | $3,414 | $233,200 | $92,600 | $140,600 |
| 2024 | $3,319 | $228,300 | $92,600 | $135,700 |
| 2023 | $2,675 | $169,500 | $80,200 | $89,300 |
| 2022 | $2,584 | $160,400 | $80,200 | $80,200 |
| 2021 | $2,493 | $148,400 | $77,200 | $71,200 |
| 2020 | $2,444 | $145,200 | $76,000 | $69,200 |
| 2019 | $2,364 | $142,000 | $74,500 | $67,500 |
| 2018 | $2,286 | $137,600 | $74,500 | $63,100 |
| 2017 | $2,208 | $135,400 | $74,500 | $60,900 |
| 2016 | $2,128 | $131,500 | $74,500 | $57,000 |
| 2015 | $2,030 | $129,000 | $74,500 | $54,500 |
Source: Public Records
Map
Nearby Homes
- 198 Beekman Dr
- 172 Beekman Dr Unit 172
- 174 Beekman Dr Unit 174
- 37 Corey Colonial
- 83 Harvey Johnson Dr
- 29 Plantation Dr Unit 29
- 28 Meadow Ave
- 72 Plantation Dr
- 795 Main St
- 18 Wildflower Ln
- 35 Birch Hill Rd
- 51 Merrell Dr
- 0 Silver St
- 4H Mapleviewlane Unit 4H
- 23 Peros Dr
- 52 Peros Dr
- 68 Peros Dr
- 354 Rowley St
- 124 Regency Park Dr
- 51 Reed St