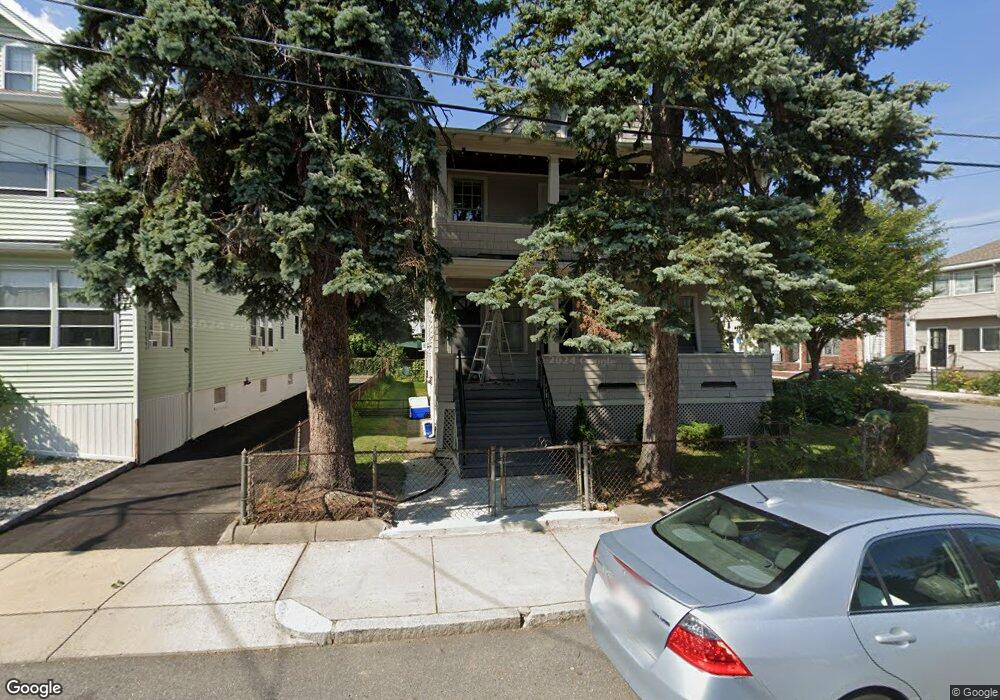
26 Eliot St Medford, MA 02155
South Medford NeighborhoodEstimated Value: $979,526 - $1,305,000
5
Beds
2
Baths
2,340
Sq Ft
$470/Sq Ft
Est. Value
About This Home
This home is located at 26 Eliot St, Medford, MA 02155 and is currently estimated at $1,100,132, approximately $470 per square foot. 26 Eliot St is a home located in Middlesex County with nearby schools including Medford High School, St. Clement Elementary School, and St. Joseph School.
Ownership History
Date
Name
Owned For
Owner Type
Purchase Details
Closed on
Jan 18, 2024
Sold by
Joy Robert A
Bought by
Eliot T T and Eliot Joy
Current Estimated Value
Purchase Details
Closed on
Aug 1, 1995
Sold by
Mobilia Joseph and Mobilia Rose
Bought by
Joy Robert A and Joy Donna
Home Financials for this Owner
Home Financials are based on the most recent Mortgage that was taken out on this home.
Original Mortgage
$100,000
Interest Rate
7.56%
Mortgage Type
Purchase Money Mortgage
Create a Home Valuation Report for This Property
The Home Valuation Report is an in-depth analysis detailing your home's value as well as a comparison with similar homes in the area
Home Values in the Area
Average Home Value in this Area
Purchase History
| Date | Buyer | Sale Price | Title Company |
|---|---|---|---|
| Eliot T T | -- | None Available | |
| Joy Robert A | $145,000 | -- |
Source: Public Records
Mortgage History
| Date | Status | Borrower | Loan Amount |
|---|---|---|---|
| Previous Owner | Joy Robert A | $285,000 | |
| Previous Owner | Joy Robert A | $227,000 | |
| Previous Owner | Joy Robert A | $100,000 |
Source: Public Records
Tax History Compared to Growth
Tax History
| Year | Tax Paid | Tax Assessment Tax Assessment Total Assessment is a certain percentage of the fair market value that is determined by local assessors to be the total taxable value of land and additions on the property. | Land | Improvement |
|---|---|---|---|---|
| 2025 | $6,773 | $794,900 | $319,400 | $475,500 |
| 2024 | $6,773 | $794,900 | $319,400 | $475,500 |
| 2023 | $6,613 | $764,500 | $298,500 | $466,000 |
| 2022 | $6,643 | $737,300 | $271,300 | $466,000 |
| 2021 | $6,258 | $665,000 | $258,400 | $406,600 |
| 2020 | $6,165 | $671,600 | $258,400 | $413,200 |
| 2019 | $0 | $611,800 | $234,900 | $376,900 |
| 2018 | $5,589 | $545,800 | $213,500 | $332,300 |
| 2017 | $5,250 | $497,200 | $199,600 | $297,600 |
| 2016 | $5,122 | $457,700 | $181,500 | $276,200 |
| 2015 | $4,847 | $414,300 | $172,800 | $241,500 |
Source: Public Records
Map
Nearby Homes
- 9 Trout Ave
- 9 Trout Ave Unit 2
- 252 Main St Unit 101
- 18 Hancock Ave
- 12 Wellesley St
- 74 Windsor Rd
- 12 George St Unit 3
- 159 Harvard St Unit 1R
- 179 Main St
- 179 Main St Unit A
- 179 Main St Unit B
- 87 College Ave
- 22 Wedgemere Rd
- 39 Bonner Ave Unit PH
- 11 Bonner Ave Unit 2
- 11 Bonner Ave Unit 1
- 31 Wareham St
- 15 Colby St
- 20 Ship Ave Unit 8
- 122 Burget Ave