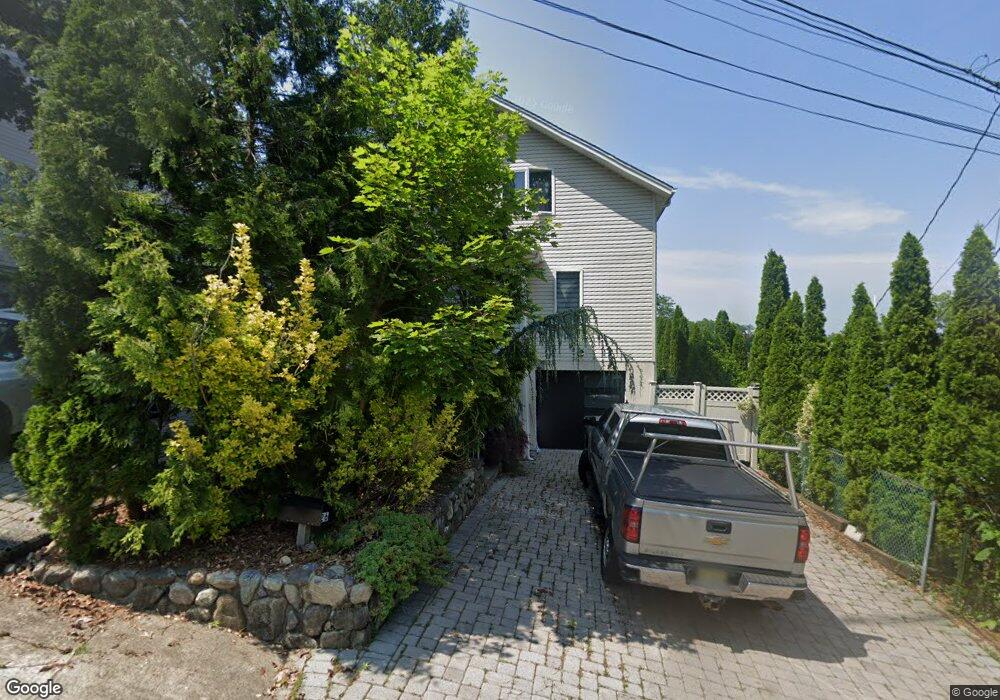
26 Elm St Butler, NJ 07405
Estimated Value: $530,000 - $609,010
--
Bed
--
Bath
1,859
Sq Ft
$309/Sq Ft
Est. Value
About This Home
This home is located at 26 Elm St, Butler, NJ 07405 and is currently estimated at $574,503, approximately $309 per square foot. 26 Elm St is a home located in Morris County with nearby schools including Aaron Decker School, Richard Butler School, and St Anthony Of Padua.
Ownership History
Date
Name
Owned For
Owner Type
Purchase Details
Closed on
Mar 25, 2010
Sold by
Murdzoski Velo and Murdzoski Snezana
Bought by
Murdzoski Stefco and Murdzoski Anna K
Current Estimated Value
Home Financials for this Owner
Home Financials are based on the most recent Mortgage that was taken out on this home.
Original Mortgage
$284,000
Outstanding Balance
$178,795
Interest Rate
4%
Mortgage Type
New Conventional
Estimated Equity
$395,708
Purchase Details
Closed on
Jun 21, 1995
Sold by
Bankers Trust Company
Bought by
Murdzoski Velo and Murdzoski Snezana
Create a Home Valuation Report for This Property
The Home Valuation Report is an in-depth analysis detailing your home's value as well as a comparison with similar homes in the area
Home Values in the Area
Average Home Value in this Area
Purchase History
| Date | Buyer | Sale Price | Title Company |
|---|---|---|---|
| Murdzoski Stefco | $355,000 | None Available | |
| Murdzoski Velo | $105,000 | Lawyers Title Insurance Corp |
Source: Public Records
Mortgage History
| Date | Status | Borrower | Loan Amount |
|---|---|---|---|
| Open | Murdzoski Stefco | $284,000 |
Source: Public Records
Tax History Compared to Growth
Tax History
| Year | Tax Paid | Tax Assessment Tax Assessment Total Assessment is a certain percentage of the fair market value that is determined by local assessors to be the total taxable value of land and additions on the property. | Land | Improvement |
|---|---|---|---|---|
| 2025 | $10,902 | $488,600 | $237,200 | $251,400 |
| 2024 | $10,759 | $436,600 | $202,200 | $234,400 |
| 2023 | $10,759 | $405,400 | $179,700 | $225,700 |
| 2022 | $10,800 | $382,300 | $172,200 | $210,100 |
| 2021 | $10,800 | $281,700 | $134,400 | $147,300 |
| 2020 | $10,524 | $281,700 | $134,400 | $147,300 |
| 2019 | $10,293 | $281,700 | $134,400 | $147,300 |
| 2018 | $10,161 | $281,700 | $134,400 | $147,300 |
| 2017 | $9,902 | $281,700 | $134,400 | $147,300 |
| 2016 | $9,645 | $281,700 | $134,400 | $147,300 |
| 2015 | $9,490 | $281,700 | $134,400 | $147,300 |
| 2014 | $9,198 | $281,700 | $134,400 | $147,300 |
Source: Public Records
Map
Nearby Homes