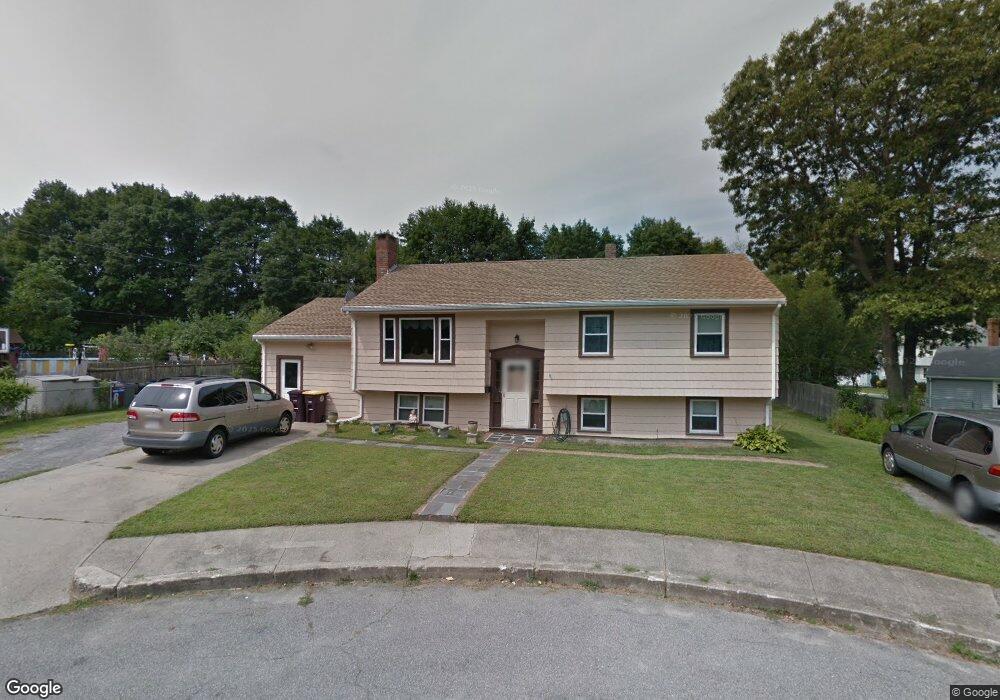
26 Erin Way South Weymouth, MA 02190
South Weymouth NeighborhoodEstimated Value: $737,000 - $853,000
4
Beds
3
Baths
2,288
Sq Ft
$340/Sq Ft
Est. Value
About This Home
This home is located at 26 Erin Way, South Weymouth, MA 02190 and is currently estimated at $778,951, approximately $340 per square foot. 26 Erin Way is a home located in Norfolk County with nearby schools including Thomas W. Hamilton Primary School, Abigail Adams Middle School, and Weymouth Middle School Chapman.
Ownership History
Date
Name
Owned For
Owner Type
Purchase Details
Closed on
Dec 9, 2020
Sold by
Pepe Elaine A
Bought by
Elaine A Pepe Irt
Current Estimated Value
Purchase Details
Closed on
Oct 24, 2003
Sold by
Mcnamara Francis X and Butler Martin G
Bought by
Pepe Elaine A and Pepe William J
Home Financials for this Owner
Home Financials are based on the most recent Mortgage that was taken out on this home.
Original Mortgage
$166,000
Interest Rate
6.15%
Mortgage Type
Purchase Money Mortgage
Purchase Details
Closed on
Sep 30, 1997
Sold by
Dilorenzo Anthony and Dilorenzo Catherine R
Bought by
Mcnamara Francis X
Create a Home Valuation Report for This Property
The Home Valuation Report is an in-depth analysis detailing your home's value as well as a comparison with similar homes in the area
Home Values in the Area
Average Home Value in this Area
Purchase History
| Date | Buyer | Sale Price | Title Company |
|---|---|---|---|
| Elaine A Pepe Irt | -- | None Available | |
| Pepe Elaine A | $395,000 | -- | |
| Mcnamara Francis X | $175,000 | -- |
Source: Public Records
Mortgage History
| Date | Status | Borrower | Loan Amount |
|---|---|---|---|
| Previous Owner | Mcnamara Francis X | $50,000 | |
| Previous Owner | Mcnamara Francis X | $225,000 | |
| Previous Owner | Mcnamara Francis X | $166,000 |
Source: Public Records
Tax History Compared to Growth
Tax History
| Year | Tax Paid | Tax Assessment Tax Assessment Total Assessment is a certain percentage of the fair market value that is determined by local assessors to be the total taxable value of land and additions on the property. | Land | Improvement |
|---|---|---|---|---|
| 2025 | $6,859 | $679,100 | $237,900 | $441,200 |
| 2024 | $6,042 | $588,300 | $226,600 | $361,700 |
| 2023 | $6,012 | $575,300 | $228,900 | $346,400 |
| 2022 | $5,967 | $520,700 | $212,000 | $308,700 |
| 2021 | $5,756 | $490,300 | $212,000 | $278,300 |
| 2020 | $5,708 | $478,900 | $212,000 | $266,900 |
| 2019 | $5,197 | $428,800 | $203,800 | $225,000 |
| 2018 | $4,919 | $393,500 | $194,100 | $199,400 |
| 2017 | $4,896 | $382,200 | $184,900 | $197,300 |
| 2016 | $4,749 | $371,000 | $177,800 | $193,200 |
| 2015 | $4,604 | $356,900 | $177,800 | $179,100 |
| 2014 | $4,448 | $334,400 | $165,400 | $169,000 |
Source: Public Records
Map
Nearby Homes
- 11 White St
- 45 Union St
- 299 Union St
- 261 Pleasant St Unit 5
- 197 White St
- 54 Fountain Ln Unit 9
- 17 Buchanan Ln
- 55 Greentree Ln Unit 27
- 65 Webster St Unit 401
- 1050 Main St Unit 1
- 27 Park Ave
- 17 Sears Rd
- 30 Alroy Rd
- 18 Ben Hogan Landing Unit 18
- 5 Oak St
- 206 Pine St
- 120 Burkhall St Unit K
- 41 Oak St
- 446 Ralph Talbot St
- 7 Woodcrest Ct Unit 4