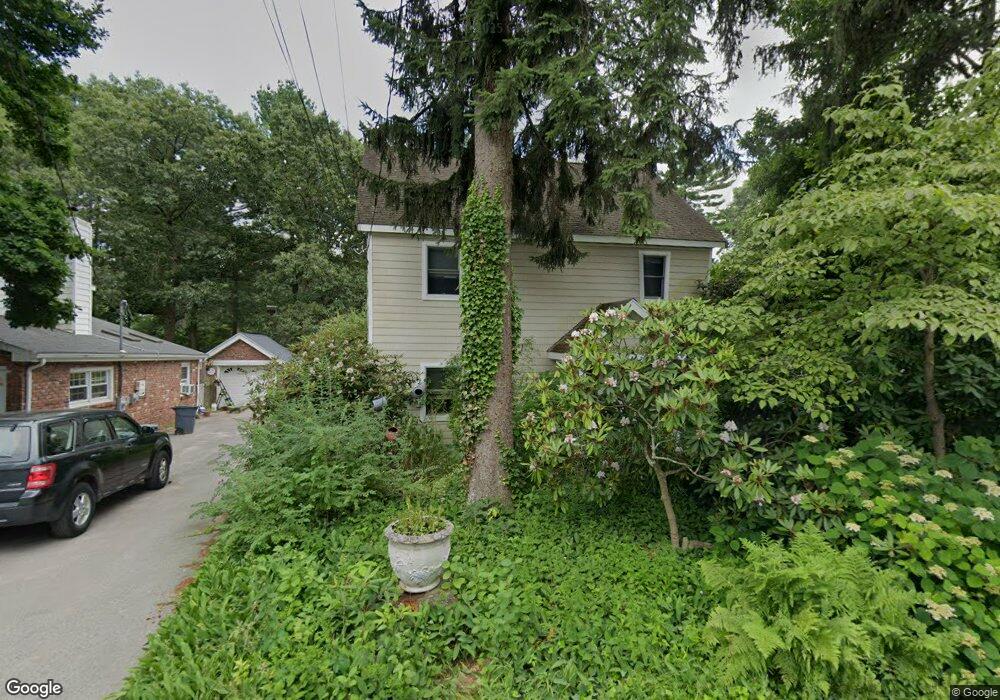
26 Evergreen Rd Natick, MA 01760
Estimated Value: $929,361 - $1,047,000
2
Beds
3
Baths
2,541
Sq Ft
$387/Sq Ft
Est. Value
About This Home
This home is located at 26 Evergreen Rd, Natick, MA 01760 and is currently estimated at $983,090, approximately $386 per square foot. 26 Evergreen Rd is a home located in Middlesex County with nearby schools including Natick High School, Bennett-Hemenway (Ben-Hem) Elementary School, and Wilson Middle School.
Ownership History
Date
Name
Owned For
Owner Type
Purchase Details
Closed on
Nov 24, 1992
Sold by
Evergreen Irrev Re T
Bought by
Edstrom Cynthia M and Kilham Louis F
Current Estimated Value
Create a Home Valuation Report for This Property
The Home Valuation Report is an in-depth analysis detailing your home's value as well as a comparison with similar homes in the area
Home Values in the Area
Average Home Value in this Area
Purchase History
| Date | Buyer | Sale Price | Title Company |
|---|---|---|---|
| Edstrom Cynthia M | $115,000 | -- |
Source: Public Records
Mortgage History
| Date | Status | Borrower | Loan Amount |
|---|---|---|---|
| Open | Edstrom Cynthia M | $337,600 | |
| Closed | Edstrom Cynthia M | $275,000 | |
| Closed | Edstrom Cynthia M | $172,000 |
Source: Public Records
Tax History
| Year | Tax Paid | Tax Assessment Tax Assessment Total Assessment is a certain percentage of the fair market value that is determined by local assessors to be the total taxable value of land and additions on the property. | Land | Improvement |
|---|---|---|---|---|
| 2025 | $9,318 | $779,100 | $441,400 | $337,700 |
| 2024 | $8,962 | $731,000 | $415,400 | $315,600 |
| 2023 | $0 | $693,700 | $398,300 | $295,400 |
| 2022 | $0 | $630,800 | $360,800 | $270,000 |
| 2021 | $8,084 | $594,000 | $340,100 | $253,900 |
| 2020 | $7,875 | $578,600 | $324,700 | $253,900 |
| 2019 | $7,354 | $578,600 | $324,700 | $253,900 |
| 2018 | $7,258 | $556,200 | $309,200 | $247,000 |
| 2017 | $6,671 | $494,500 | $266,500 | $228,000 |
| 2016 | $6,397 | $471,400 | $245,500 | $225,900 |
| 2015 | $6,259 | $452,900 | $245,500 | $207,400 |
Source: Public Records
Map
Nearby Homes
- 5 Griffin Cir
- 50 Wethersfield Rd
- 136 Commonwealth Rd
- 293 Bacon St Unit A
- 2 Darby Ct
- 4 Richard Rd
- 83 Felch Rd
- 29 Irving Rd
- 25 Irving Rd
- 7 Jackson Ct Unit B
- 8 Liberty St
- 10 Nouvelle Way Unit 803
- 40 Nouvelle Way Unit 441
- 10 Nouvelle Way Unit 923
- 45 W Plain St Unit 1
- 27 2nd St
- 186 Main St
- 43 Charles St
- 41 Charles St
- 44 Harwood Rd
Your Personal Tour Guide
Ask me questions while you tour the home.