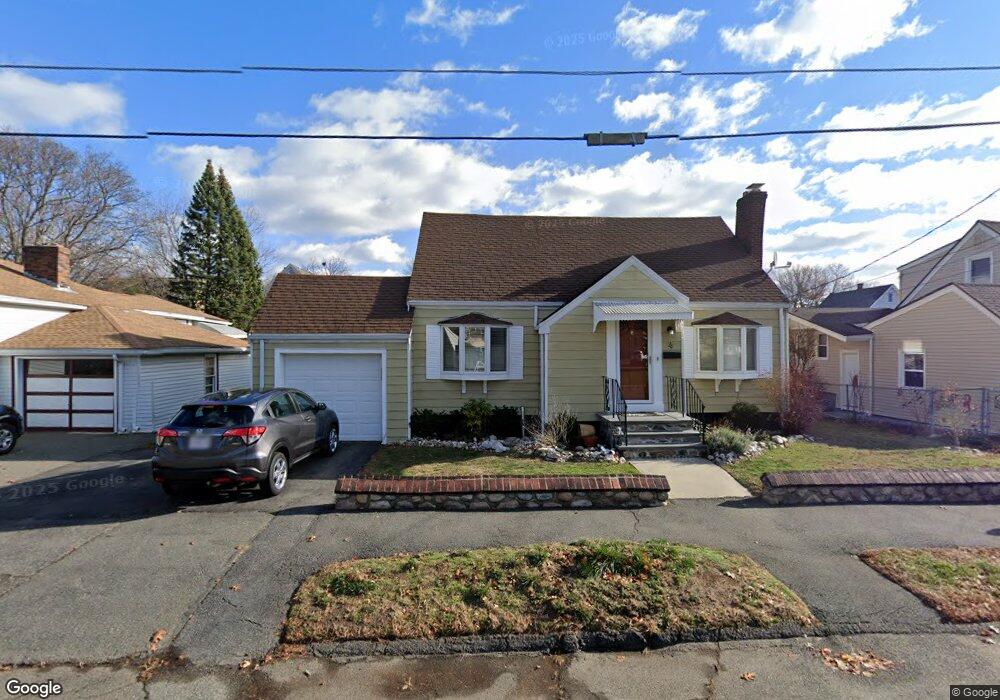
26 Farrell Rd Lynn, MA 01905
Lower Boston Street NeighborhoodEstimated Value: $597,000 - $637,000
3
Beds
2
Baths
1,496
Sq Ft
$411/Sq Ft
Est. Value
About This Home
This home is located at 26 Farrell Rd, Lynn, MA 01905 and is currently estimated at $614,349, approximately $410 per square foot. 26 Farrell Rd is a home located in Essex County with nearby schools including Lincoln-Thomson Elementary School, William R. Fallon School, and Breed Middle School.
Ownership History
Date
Name
Owned For
Owner Type
Purchase Details
Closed on
Apr 18, 2013
Sold by
Russo Claire M Est
Bought by
Grillo Sharon
Current Estimated Value
Home Financials for this Owner
Home Financials are based on the most recent Mortgage that was taken out on this home.
Original Mortgage
$180,000
Outstanding Balance
$125,588
Interest Rate
3.52%
Mortgage Type
New Conventional
Estimated Equity
$488,761
Create a Home Valuation Report for This Property
The Home Valuation Report is an in-depth analysis detailing your home's value as well as a comparison with similar homes in the area
Home Values in the Area
Average Home Value in this Area
Purchase History
| Date | Buyer | Sale Price | Title Company |
|---|---|---|---|
| Grillo Sharon | $225,000 | -- |
Source: Public Records
Mortgage History
| Date | Status | Borrower | Loan Amount |
|---|---|---|---|
| Open | Grillo Sharon | $180,000 |
Source: Public Records
Tax History
| Year | Tax Paid | Tax Assessment Tax Assessment Total Assessment is a certain percentage of the fair market value that is determined by local assessors to be the total taxable value of land and additions on the property. | Land | Improvement |
|---|---|---|---|---|
| 2025 | $6,261 | $604,300 | $226,900 | $377,400 |
| 2024 | $5,758 | $546,800 | $199,300 | $347,500 |
| 2023 | $5,699 | $511,100 | $205,900 | $305,200 |
| 2022 | $5,402 | $434,600 | $152,400 | $282,200 |
| 2021 | $4,992 | $383,100 | $140,200 | $242,900 |
| 2020 | $4,874 | $363,700 | $134,900 | $228,800 |
| 2019 | $4,928 | $344,600 | $127,000 | $217,600 |
| 2018 | $4,953 | $326,900 | $140,200 | $186,700 |
| 2017 | $4,551 | $291,700 | $116,500 | $175,200 |
| 2016 | $4,433 | $274,000 | $109,100 | $164,900 |
| 2015 | $4,253 | $253,900 | $108,200 | $145,700 |
Source: Public Records
Map
Nearby Homes
- 70 Farrell Rd
- 268 Walnut St
- 28 Wyman St
- 32 Birch Brook Landing Unit 25
- 32 Birch Brook Landing Unit 22
- 32 Birch Brook Rd Unit 13
- 32 Birch Brook Rd Unit 27
- 32 Birch Brook Rd Unit 26
- 32 Birch Brook Rd Unit 16
- 32 Birch Brook Rd Unit 1
- 32 Birch Brook Rd Unit 15
- 32 Birch Brook Rd Unit 14
- 32 Birch Brook Rd Unit 28
- 73 Waterhill St
- 79 Laurel St
- 93 Robinson St
- 50-50A Kirtland St
- 447 Boston St
- 37 Sargents Ct
- 20 Murray St
Your Personal Tour Guide
Ask me questions while you tour the home.