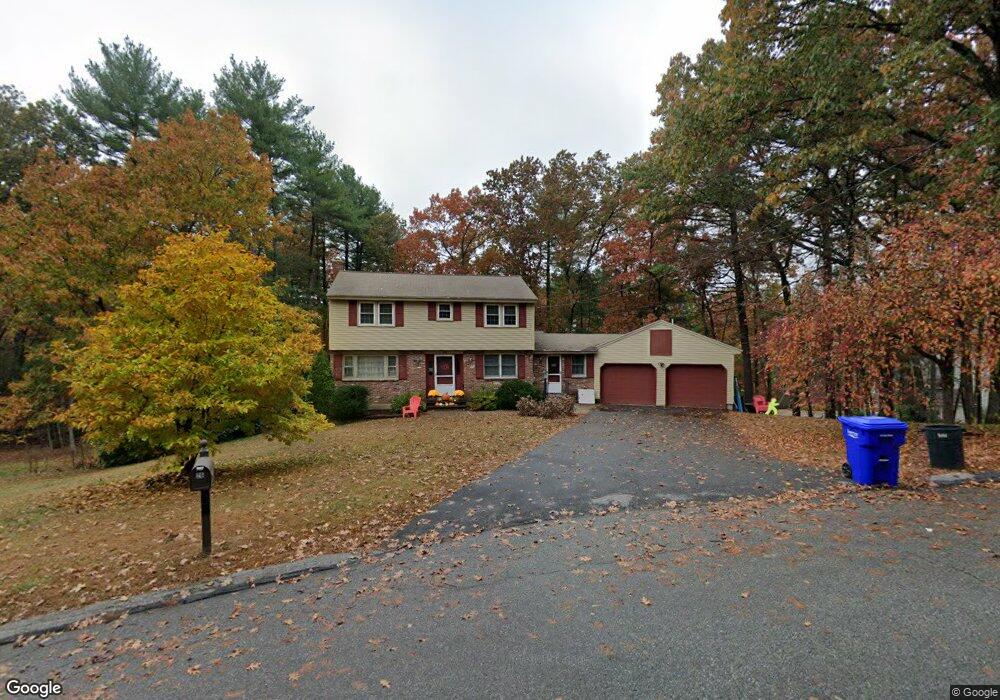
26 George Rd Maynard, MA 01754
Estimated Value: $722,585 - $835,000
4
Beds
2
Baths
1,984
Sq Ft
$384/Sq Ft
Est. Value
About This Home
This home is located at 26 George Rd, Maynard, MA 01754 and is currently estimated at $762,146, approximately $384 per square foot. 26 George Rd is a home located in Middlesex County with nearby schools including Green Meadow School, Fowler School, and Maynard High School.
Ownership History
Date
Name
Owned For
Owner Type
Purchase Details
Closed on
Jul 7, 2009
Sold by
Sullivan Janet M
Bought by
Finnerty Colleen M and Finnerty Sean T
Current Estimated Value
Home Financials for this Owner
Home Financials are based on the most recent Mortgage that was taken out on this home.
Original Mortgage
$320,000
Outstanding Balance
$201,421
Interest Rate
4.86%
Mortgage Type
Purchase Money Mortgage
Estimated Equity
$560,725
Create a Home Valuation Report for This Property
The Home Valuation Report is an in-depth analysis detailing your home's value as well as a comparison with similar homes in the area
Home Values in the Area
Average Home Value in this Area
Purchase History
| Date | Buyer | Sale Price | Title Company |
|---|---|---|---|
| Finnerty Colleen M | $400,000 | -- |
Source: Public Records
Mortgage History
| Date | Status | Borrower | Loan Amount |
|---|---|---|---|
| Open | Finnerty Colleen M | $320,000 |
Source: Public Records
Tax History
| Year | Tax Paid | Tax Assessment Tax Assessment Total Assessment is a certain percentage of the fair market value that is determined by local assessors to be the total taxable value of land and additions on the property. | Land | Improvement |
|---|---|---|---|---|
| 2025 | $10,634 | $596,400 | $308,700 | $287,700 |
| 2024 | $10,083 | $563,900 | $294,600 | $269,300 |
| 2023 | $9,893 | $521,500 | $280,100 | $241,400 |
| 2022 | $8,936 | $435,500 | $236,900 | $198,600 |
| 2021 | $8,777 | $435,600 | $236,900 | $198,700 |
| 2020 | $8,834 | $428,000 | $215,300 | $212,700 |
| 2019 | $8,500 | $404,000 | $206,100 | $197,900 |
| 2018 | $6,838 | $382,100 | $188,300 | $193,800 |
| 2017 | $8,410 | $382,100 | $188,300 | $193,800 |
| 2016 | $8,120 | $382,100 | $188,300 | $193,800 |
| 2015 | $7,762 | $347,900 | $180,200 | $167,700 |
| 2014 | $7,554 | $338,900 | $174,800 | $164,100 |
Source: Public Records
Map
Nearby Homes
- 71 Liberty St
- 2 Marble Farm Rd
- 6 Durant Ave
- 63 Conant St
- 12 Patti Ln
- 12 Brown St
- 10 Mill St Unit Q
- 10 Mill St Unit B
- 17 Prospect St
- 37 Glendale St
- 19 Railroad St Unit D2
- 19 Railroad St Unit C2
- 40 High St
- 131 Main St
- 129 Main St Unit 129
- 30 Brewster Ln
- 66 Powder Mill Rd
- 68 Powder Mill Rd
- 25 Nylander Way
- 70 Powder Mill Rd
Your Personal Tour Guide
Ask me questions while you tour the home.