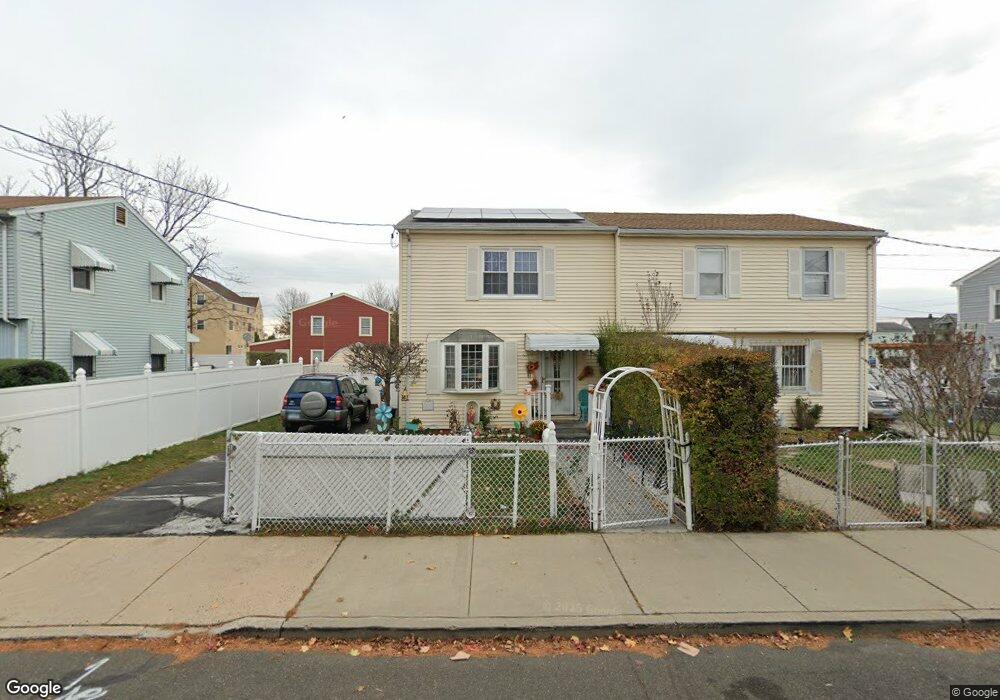
26 Gilmore St Bridgeport, CT 06608
East Side Bridgeport NeighborhoodEstimated Value: $216,000 - $262,911
2
Beds
1
Bath
960
Sq Ft
$257/Sq Ft
Est. Value
About This Home
This home is located at 26 Gilmore St, Bridgeport, CT 06608 and is currently estimated at $246,478, approximately $256 per square foot. 26 Gilmore St is a home located in Fairfield County with nearby schools including Waltersville School, Harding High School, and Capital Prep Harbor Upper School.
Ownership History
Date
Name
Owned For
Owner Type
Purchase Details
Closed on
Jun 4, 2012
Sold by
Vasquez Diogenes
Bought by
Vazquez Ibis
Current Estimated Value
Home Financials for this Owner
Home Financials are based on the most recent Mortgage that was taken out on this home.
Original Mortgage
$48,000
Outstanding Balance
$33,375
Interest Rate
3.9%
Mortgage Type
New Conventional
Estimated Equity
$213,103
Create a Home Valuation Report for This Property
The Home Valuation Report is an in-depth analysis detailing your home's value as well as a comparison with similar homes in the area
Home Values in the Area
Average Home Value in this Area
Purchase History
| Date | Buyer | Sale Price | Title Company |
|---|---|---|---|
| Vazquez Ibis | -- | -- | |
| Vazquez Ibis | -- | -- |
Source: Public Records
Mortgage History
| Date | Status | Borrower | Loan Amount |
|---|---|---|---|
| Open | Vazquez Ibis | $48,000 |
Source: Public Records
Tax History Compared to Growth
Tax History
| Year | Tax Paid | Tax Assessment Tax Assessment Total Assessment is a certain percentage of the fair market value that is determined by local assessors to be the total taxable value of land and additions on the property. | Land | Improvement |
|---|---|---|---|---|
| 2025 | $4,406 | $101,400 | $20,460 | $80,940 |
| 2024 | $4,406 | $101,400 | $20,460 | $80,940 |
| 2023 | $4,406 | $101,400 | $20,460 | $80,940 |
| 2022 | $4,406 | $101,400 | $20,460 | $80,940 |
| 2021 | $4,406 | $101,400 | $20,460 | $80,940 |
| 2020 | $3,401 | $63,000 | $9,700 | $53,300 |
| 2019 | $3,401 | $63,000 | $9,700 | $53,300 |
| 2018 | $3,425 | $63,000 | $9,700 | $53,300 |
| 2017 | $3,425 | $63,000 | $9,700 | $53,300 |
| 2016 | $3,425 | $63,000 | $9,700 | $53,300 |
| 2015 | $3,724 | $88,240 | $16,420 | $71,820 |
| 2014 | $3,724 | $88,240 | $16,420 | $71,820 |
Source: Public Records
Map
Nearby Homes
- 249 Hough Ave Unit 251
- 445 Nichols St
- 60 Gilmore St
- 509 Pembroke St
- 691 E Main St
- 520 Seaview Ave
- 180 Holly St
- 247 6th St
- 228 Holly St Unit 230
- 40 5th St
- 800 Seaview Ave Unit 790-3
- 221 Bunnell St
- 704 Maple St
- 746 Maple St
- 93 Clifford St
- 54 6th St
- 49 Bunnell St Unit 51
- 643 Newfield Ave Unit 645
- 147 Helen St Unit 149
- 696 Kossuth St Unit 698
- 22 Gilmore St
- 38 Gilmore St
- 10 Gilmore St
- 42 Gilmore St
- 17 Gilmore St
- 6 Gilmore St
- 31 Gilmore St Unit 37
- 15 Gilmore St Unit 17
- 39 Sherman Park Ln
- 190 Steuben St
- 57 Sherman St
- 28 Sherman Park Ln
- 60 Gilmore St Unit 9
- 60 Gilmore St Unit 16
- 60 Gilmore St Unit 10
- 123 Sherman St
- 32 Sherman Park Ln
- 47 Sherman St
- 158 Steuben St
- 158 Steuben St Unit A