
Seller's Agent in 2025
Katie Fish
Keller Williams Inspire - Geneva
(847) 560-3474
2 in this area
317 Total Sales
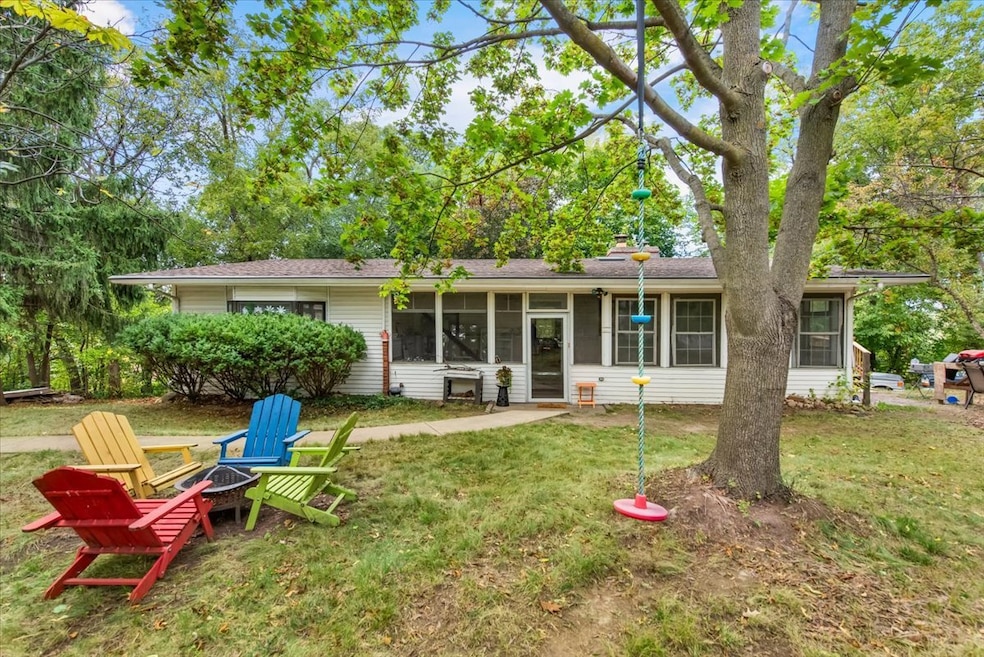
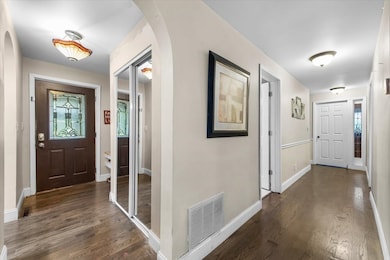
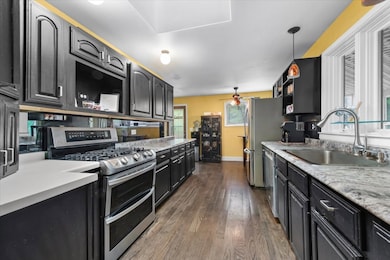
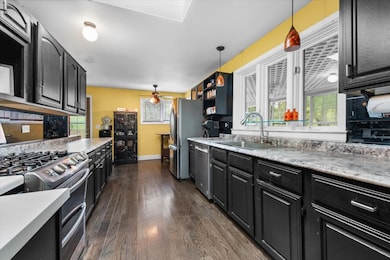
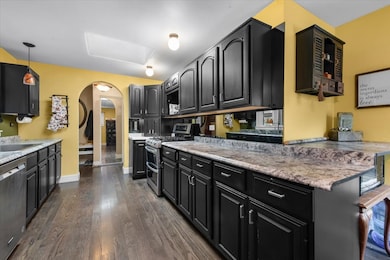
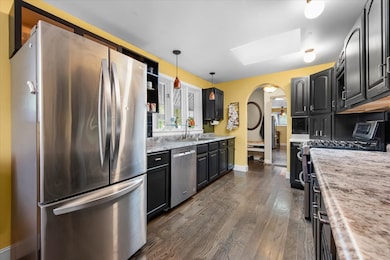
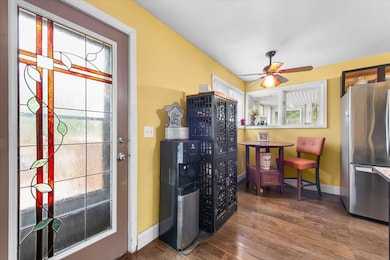
RANCH HOME with a walkout basement with ROOM TO ROAM! Unincorporated! You will feel like you are living at a lake home! 3 bedrooms, 2 bathrooms, screened-in porch, brand new deck and full walkout basement on almost a half acre in unincorporated Elgin. Open living and dining spaces with big picture windows. Kitchen with ample cabinets and countertop space and stainless steel appliances. A large screened-in porch and laundry room complete the main level. Spacious master bedroom and ensuite bath with shower over tub combo. 2 additional sizable bedrooms and full hall bath with shower stall. Walkout basement offers you a blank slate.....create a family room around the wood-burning fireplace, re-create the kitchenette, complete the rough-in bath, and use the rest of the space for a recreation area. Enjoy the beautiful wooded views from the new wrap around deck or in the abundant open greenspace. The deck features extra wide stairs, one gate, 1.5" decking, concealed fasteners and no visible screws....sleek! 2 driveways for abundant parking! Life's unexpected turns have led the sellers to offer their charming and unique home on a lovely wooded corner lot. Add your finishing touches to complete the few remaining projects and make it your own!
Last Agent to Sell the Property
Keller Williams Inspire - Geneva License #475130544 Listed on: 10/16/2025
Last Buyer's Agent
Jessica Losch
Redfin Corporation License #475197182
| Date | Type | Sale Price | Title Company |
|---|---|---|---|
| Warranty Deed | $325,000 | Chicago Title Insurance Compan | |
| Quit Claim Deed | -- | None Listed On Document | |
| Joint Tenancy Deed | $140,000 | None Available | |
| Interfamily Deed Transfer | -- | None Available | |
| Interfamily Deed Transfer | -- | -- |
| Date | Status | Loan Amount | Loan Type |
|---|---|---|---|
| Open | $315,250 | New Conventional | |
| Previous Owner | $137,464 | FHA |
| Date | Event | Price | List to Sale | Price per Sq Ft |
|---|---|---|---|---|
| 12/15/2025 12/15/25 | Sold | $325,000 | +2.2% | $124 / Sq Ft |
| 11/08/2025 11/08/25 | Pending | -- | -- | -- |
| 10/16/2025 10/16/25 | For Sale | $318,108 | -- | $121 / Sq Ft |
| Year | Tax Paid | Tax Assessment Tax Assessment Total Assessment is a certain percentage of the fair market value that is determined by local assessors to be the total taxable value of land and additions on the property. | Land | Improvement |
|---|---|---|---|---|
| 2025 | $6,194 | $31,000 | $12,342 | $18,658 |
| 2024 | $6,194 | $27,000 | $3,600 | $23,400 |
| 2023 | $5,976 | $27,000 | $3,600 | $23,400 |
| 2022 | $5,976 | $27,000 | $3,600 | $23,400 |
| 2021 | $5,998 | $22,807 | $2,571 | $20,236 |
| 2020 | $5,974 | $22,807 | $2,571 | $20,236 |
| 2019 | $5,910 | $25,342 | $2,571 | $22,771 |
| 2018 | $5,860 | $23,267 | $2,057 | $21,210 |
| 2017 | $5,742 | $23,267 | $2,057 | $21,210 |
| 2016 | $5,614 | $23,267 | $2,057 | $21,210 |
| 2015 | $5,652 | $21,635 | $1,542 | $20,093 |
| 2014 | $5,586 | $21,635 | $1,542 | $20,093 |
| 2013 | $5,373 | $21,635 | $1,542 | $20,093 |
Seller's Agent in 2025
Katie Fish
Keller Williams Inspire - Geneva
(847) 560-3474
2 in this area
317 Total Sales
J
Buyer's Agent in 2025
Jessica Losch
Redfin Corporation
Source: Midwest Real Estate Data (MRED)
MLS Number: 12494872
APN: 06-17-301-005-0000
Disclaimer: Certain information contained herein is derived from information provided by parties other than Homes.com. All information provided is deemed reliable, but is not guaranteed to be accurate and should be independently verified.
![]() Based on information submitted to the MLS GRID. All data is obtained from various sources and may not have been verified by broker or MLS GRID. Supplied Open House Information is subject to change without notice. All information should be independently reviewed and verified for accuracy. Properties may or may not be listed by the office/agent presenting the information. Some IDX listings have been excluded from this website.
Based on information submitted to the MLS GRID. All data is obtained from various sources and may not have been verified by broker or MLS GRID. Supplied Open House Information is subject to change without notice. All information should be independently reviewed and verified for accuracy. Properties may or may not be listed by the office/agent presenting the information. Some IDX listings have been excluded from this website.
Based on information submitted to the MLS GRID
Ask me questions while you tour the home.