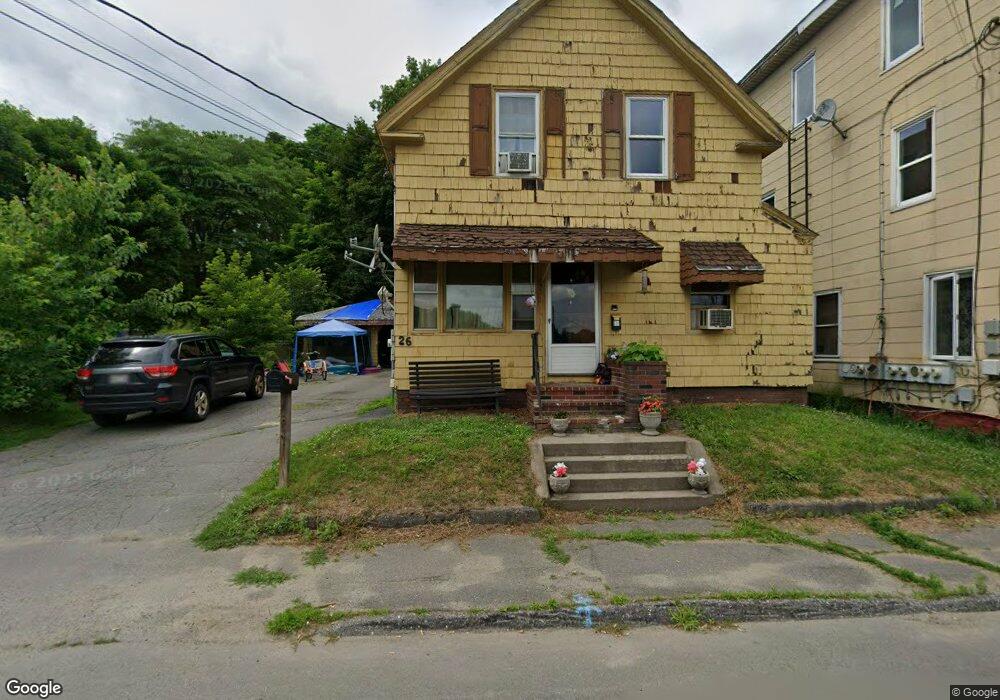
26 Green St Waterville, ME 04901
Estimated Value: $145,914 - $213,000
4
Beds
2
Baths
2,028
Sq Ft
$93/Sq Ft
Est. Value
About This Home
This home is located at 26 Green St, Waterville, ME 04901 and is currently estimated at $188,979, approximately $93 per square foot. 26 Green St is a home located in Kennebec County with nearby schools including George J. Mitchell School, Albert S. Hall School, and Waterville Junior High School.
Ownership History
Date
Name
Owned For
Owner Type
Purchase Details
Closed on
Oct 13, 2020
Sold by
Waterville Town Of
Bought by
South End Cafe Llc
Current Estimated Value
Purchase Details
Closed on
May 15, 2017
Sold by
Distr Waterville Sewerage
Bought by
South End Cafe Llc
Purchase Details
Closed on
Mar 23, 2017
Sold by
South End Cafe Llc
Bought by
Winslow Car Wash Llc
Purchase Details
Closed on
Oct 17, 2008
Sold by
Gregoire Irene D
Bought by
South End Cafe Llc
Purchase Details
Closed on
Jan 18, 2006
Sold by
Waterville City Of
Bought by
South End Cafe Llc
Create a Home Valuation Report for This Property
The Home Valuation Report is an in-depth analysis detailing your home's value as well as a comparison with similar homes in the area
Home Values in the Area
Average Home Value in this Area
Purchase History
| Date | Buyer | Sale Price | Title Company |
|---|---|---|---|
| South End Cafe Llc | -- | None Available | |
| South End Cafe Llc | -- | -- | |
| Winslow Car Wash Llc | -- | -- | |
| South End Cafe Llc | -- | -- | |
| South End Cafe Llc | -- | -- |
Source: Public Records
Tax History Compared to Growth
Tax History
| Year | Tax Paid | Tax Assessment Tax Assessment Total Assessment is a certain percentage of the fair market value that is determined by local assessors to be the total taxable value of land and additions on the property. | Land | Improvement |
|---|---|---|---|---|
| 2025 | $2,106 | $123,900 | $9,100 | $114,800 |
| 2024 | $1,474 | $73,700 | $7,000 | $66,700 |
| 2023 | $1,467 | $73,700 | $7,000 | $66,700 |
| 2022 | $1,016 | $39,300 | $5,300 | $34,000 |
| 2021 | $1,002 | $39,300 | $5,300 | $34,000 |
| 2020 | $1,012 | $39,300 | $5,300 | $34,000 |
| 2019 | $1,012 | $39,300 | $5,300 | $34,000 |
| 2018 | $993 | $39,300 | $5,300 | $34,000 |
| 2017 | $917 | $39,300 | $5,300 | $34,000 |
| 2016 | $896 | $39,300 | $5,300 | $34,000 |
| 2015 | $1,576 | $56,700 | $6,100 | $50,600 |
| 2014 | $1,554 | $56,700 | $6,100 | $50,600 |
| 2013 | $1,554 | $56,700 | $6,100 | $50,600 |
Source: Public Records
Map
Nearby Homes