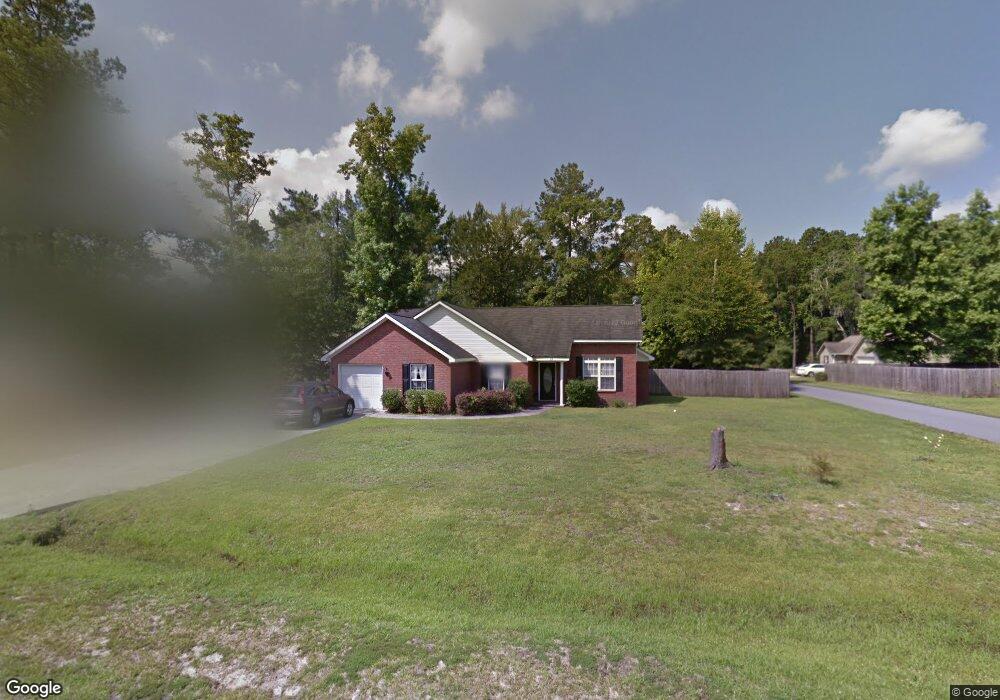
26 Hidden Creek Dr Guyton, GA 31312
Estimated Value: $283,000 - $301,000
--
Bed
1
Bath
1,350
Sq Ft
$217/Sq Ft
Est. Value
About This Home
This home is located at 26 Hidden Creek Dr, Guyton, GA 31312 and is currently estimated at $292,914, approximately $216 per square foot. 26 Hidden Creek Dr is a home located in Effingham County with nearby schools including Guyton Elementary School, Effingham County Middle School, and Effingham County High School.
Ownership History
Date
Name
Owned For
Owner Type
Purchase Details
Closed on
Jun 18, 2021
Sold by
Conner Charlotte L
Bought by
Lesko Richard
Current Estimated Value
Home Financials for this Owner
Home Financials are based on the most recent Mortgage that was taken out on this home.
Original Mortgage
$198,550
Outstanding Balance
$178,977
Interest Rate
2.9%
Mortgage Type
New Conventional
Estimated Equity
$113,937
Purchase Details
Closed on
Jul 8, 2015
Sold by
Jpmorgan Chase Bank
Bought by
Williams Ann Mathis
Purchase Details
Closed on
Aug 5, 2014
Sold by
Pierce Brandon L
Bought by
Jpmorgan Chase Bank
Purchase Details
Closed on
Jul 3, 2012
Sold by
Wells Fargo Bank Na
Bought by
Secretary Of Veterans Affairs
Purchase Details
Closed on
Nov 6, 2003
Bought by
Barlowe Ii Edward K
Create a Home Valuation Report for This Property
The Home Valuation Report is an in-depth analysis detailing your home's value as well as a comparison with similar homes in the area
Home Values in the Area
Average Home Value in this Area
Purchase History
| Date | Buyer | Sale Price | Title Company |
|---|---|---|---|
| Lesko Richard | $209,000 | -- | |
| Williams Ann Mathis | $110,500 | -- | |
| Jpmorgan Chase Bank | $116,450 | -- | |
| Secretary Of Veterans Affairs | $95,200 | -- | |
| Barlowe Ii Edward K | $123,500 | -- |
Source: Public Records
Mortgage History
| Date | Status | Borrower | Loan Amount |
|---|---|---|---|
| Open | Lesko Richard | $198,550 |
Source: Public Records
Tax History Compared to Growth
Tax History
| Year | Tax Paid | Tax Assessment Tax Assessment Total Assessment is a certain percentage of the fair market value that is determined by local assessors to be the total taxable value of land and additions on the property. | Land | Improvement |
|---|---|---|---|---|
| 2025 | $3,605 | $111,289 | $22,800 | $88,489 |
| 2024 | $3,605 | $103,097 | $22,800 | $80,297 |
| 2023 | $2,267 | $77,593 | $17,600 | $59,993 |
| 2022 | $2,370 | $74,793 | $14,800 | $59,993 |
| 2021 | $1,015 | $66,966 | $15,000 | $51,966 |
| 2020 | $984 | $60,292 | $12,000 | $48,292 |
| 2019 | $989 | $58,292 | $10,000 | $48,292 |
| 2018 | $891 | $54,814 | $10,000 | $44,814 |
| 2017 | $867 | $54,814 | $10,000 | $44,814 |
| 2016 | $851 | $51,014 | $10,000 | $41,014 |
| 2015 | -- | $46,043 | $6,800 | $39,243 |
| 2014 | -- | $39,702 | $4,000 | $35,702 |
| 2013 | -- | $39,702 | $4,000 | $35,702 |
Source: Public Records
Map
Nearby Homes
- 24 Hidden Creek Dr Unit B
- 3 Hidden Path
- 0 Little McCall Rd Unit SA342297
- 121 Little McCall Rd
- 2575 Hwy 119 S
- 0 Highway 119 S Unit SA339898
- 216 Caroline Way
- 233 Caroline Way
- The Burton Plan at Guyton Station - Guyton Station
- The Cypress Plan at Guyton Station - Guyton Station
- The Jasmine Plan at Guyton Station - Guyton Station
- The Bellamy Plan at Guyton Station - Guyton Station
- The Clayton Plan at Guyton Station - Guyton Station
- The Clayton (4bdr) Plan at Guyton Station - Guyton Station
- 2277 Georgia 119
- 210 Glick Way
- 206 Glick Way
- 213 Glick Way
- 215 Glick Way
- 406 Church St
- 26 Hidden Creek Dr
- 28A Hidden Creek Dr
- 28 Hidden Creek Dr Unit 28C
- 28 Hidden Creek Dr Unit A
- 28 Hidden Creek Dr
- 28 Hidden Creek Dr Unit B
- 28 Hidden Creek Dr Unit C
- 24A Hidden Creek Dr
- 14 Hidden Creek Dr
- 12 Hidden Creek Dr
- 29 Hidden Creek Dr
- 24 Hidden Creek Dr
- 24B Hidden Creek Dr
- 27 Hidden Creek Dr
- 31 Hidden Creek Dr
- 30 Hidden Creek Dr
- 30A Hidden Creek Dr
- 22 Hidden Creek Dr
- 33 Hidden Creek Dr
- 25 Hidden Creek Dr