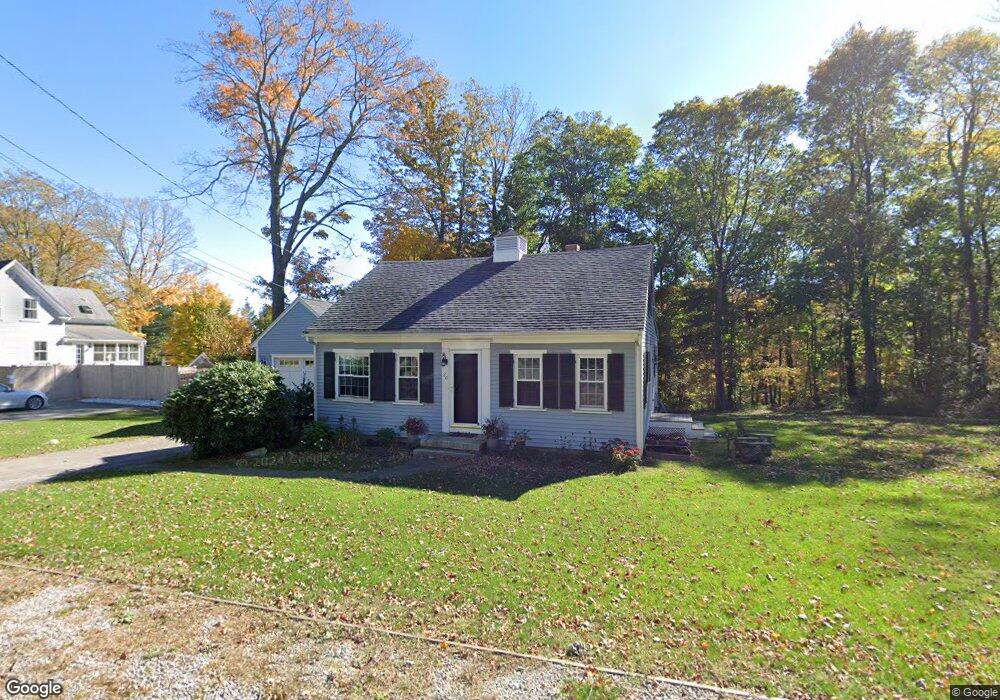
26 High St Hingham, MA 02043
Estimated Value: $921,000 - $1,039,000
3
Beds
2
Baths
1,774
Sq Ft
$548/Sq Ft
Est. Value
About This Home
This home is located at 26 High St, Hingham, MA 02043 and is currently estimated at $972,026, approximately $547 per square foot. 26 High St is a home located in Plymouth County with nearby schools including Plymouth River Elementary School, Hingham Middle School, and Hingham High School.
Ownership History
Date
Name
Owned For
Owner Type
Purchase Details
Closed on
Oct 13, 2000
Sold by
Leveille Sheri L
Bought by
Barry Mary F
Current Estimated Value
Home Financials for this Owner
Home Financials are based on the most recent Mortgage that was taken out on this home.
Original Mortgage
$252,700
Outstanding Balance
$91,959
Interest Rate
7.89%
Mortgage Type
Purchase Money Mortgage
Estimated Equity
$880,067
Purchase Details
Closed on
Sep 16, 1997
Sold by
Cashman Robert M and Cashman Beverly V
Bought by
Leveille Sheri L
Home Financials for this Owner
Home Financials are based on the most recent Mortgage that was taken out on this home.
Original Mortgage
$175,200
Interest Rate
7.31%
Mortgage Type
Purchase Money Mortgage
Create a Home Valuation Report for This Property
The Home Valuation Report is an in-depth analysis detailing your home's value as well as a comparison with similar homes in the area
Purchase History
| Date | Buyer | Sale Price | Title Company |
|---|---|---|---|
| Barry Mary F | $329,000 | -- | |
| Leveille Sheri L | $219,000 | -- |
Source: Public Records
Mortgage History
| Date | Status | Borrower | Loan Amount |
|---|---|---|---|
| Open | Barry Mary F | $252,700 | |
| Previous Owner | Leveille Sheri L | $175,200 | |
| Closed | Barry Mary F | $43,400 |
Source: Public Records
Tax History
| Year | Tax Paid | Tax Assessment Tax Assessment Total Assessment is a certain percentage of the fair market value that is determined by local assessors to be the total taxable value of land and additions on the property. | Land | Improvement |
|---|---|---|---|---|
| 2025 | $8,356 | $781,700 | $460,800 | $320,900 |
| 2024 | $8,066 | $743,400 | $460,800 | $282,600 |
| 2023 | $7,051 | $705,100 | $460,800 | $244,300 |
| 2022 | $6,435 | $556,700 | $355,700 | $201,000 |
| 2021 | $6,243 | $529,100 | $355,700 | $173,400 |
| 2020 | $6,101 | $529,100 | $355,700 | $173,400 |
| 2019 | $4,646 | $513,800 | $355,700 | $158,100 |
| 2018 | $6,012 | $510,800 | $355,700 | $155,100 |
| 2017 | $4,739 | $518,900 | $363,800 | $155,100 |
| 2016 | $6,265 | $501,600 | $346,500 | $155,100 |
| 2015 | $6,078 | $485,100 | $330,000 | $155,100 |
Source: Public Records
Map
Nearby Homes
Your Personal Tour Guide
Ask me questions while you tour the home.