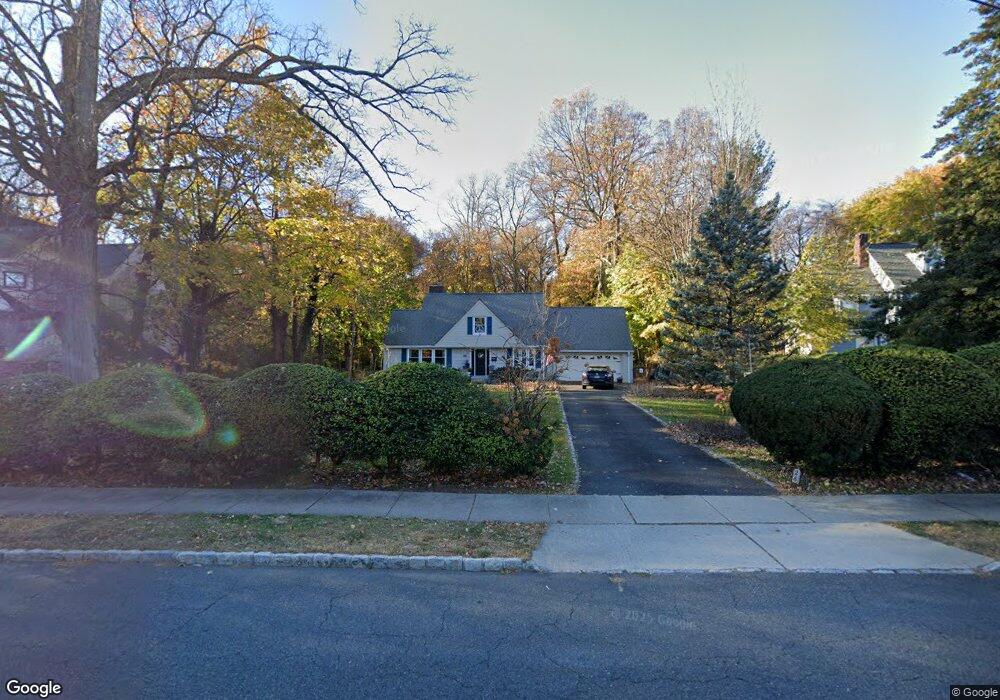
26 High St Montclair, NJ 07042
Montclair South End NeighborhoodEstimated Value: $836,697 - $1,012,000
Studio
--
Bath
1,681
Sq Ft
$545/Sq Ft
Est. Value
About This Home
This home is located at 26 High St, Montclair, NJ 07042 and is currently estimated at $916,424, approximately $545 per square foot. 26 High St is a home located in Essex County with nearby schools including Nishuane School, Hillside School, and Bradford School.
Ownership History
Date
Name
Owned For
Owner Type
Purchase Details
Closed on
Jun 14, 2006
Current Estimated Value
Purchase Details
Closed on
Aug 13, 1998
Sold by
Jones William
Bought by
Buonassissi John and Buonassissi Mary
Home Financials for this Owner
Home Financials are based on the most recent Mortgage that was taken out on this home.
Original Mortgage
$180,400
Interest Rate
6.74%
Purchase Details
Closed on
Jan 21, 1992
Sold by
Hawkins W Lincoln Et Als
Bought by
Jones William D Et Als
Create a Home Valuation Report for This Property
The Home Valuation Report is an in-depth analysis detailing your home's value as well as a comparison with similar homes in the area
Home Values in the Area
Average Home Value in this Area
Purchase History
| Date | Buyer | Sale Price | Title Company |
|---|---|---|---|
| -- | -- | -- | |
| Buonassissi John | $225,500 | -- | |
| Jones William D Et Als | $180,000 | -- |
Source: Public Records
Mortgage History
| Date | Status | Borrower | Loan Amount |
|---|---|---|---|
| Previous Owner | Buonassissi John | $180,400 |
Source: Public Records
Tax History
| Year | Tax Paid | Tax Assessment Tax Assessment Total Assessment is a certain percentage of the fair market value that is determined by local assessors to be the total taxable value of land and additions on the property. | Land | Improvement |
|---|---|---|---|---|
| 2025 | $15,041 | $445,000 | $240,200 | $204,800 |
| 2024 | $15,041 | $445,000 | $240,200 | $204,800 |
| 2022 | $14,632 | $445,000 | $240,200 | $204,800 |
| 2021 | $14,378 | $445,000 | $240,200 | $204,800 |
| 2020 | $14,147 | $445,000 | $240,200 | $204,800 |
| 2019 | $14,000 | $445,000 | $240,200 | $204,800 |
| 2018 | $13,768 | $445,000 | $240,200 | $204,800 |
| 2017 | $12,050 | $322,700 | $133,700 | $189,000 |
| 2016 | $11,727 | $322,700 | $133,700 | $189,000 |
| 2015 | $11,378 | $322,700 | $133,700 | $189,000 |
| 2014 | $10,998 | $322,700 | $133,700 | $189,000 |
Source: Public Records
Map
Nearby Homes
- 114 Harrison Ave
- 28 Irving St
- 25 Melrose Place
- 44 Madison Ave
- 8 Madison Ave
- 101 Gates Ave Unit A2
- 101 Gates Ave Unit 2A
- 116 Maple Ave
- 112 Lincoln St
- 20 Monroe Place
- 39 Harrison Ave Unit 8
- 39 Harrison Ave Unit 19
- 20 Prospect Terrace
- 17 Wilfred St
- 6 Franklin Ave
- 10 Harrison Ave
- 17 Mission St
- 12 Enfield Ave
- 40 Franklin Place
- 5 Roosevelt Place Unit 4A
Your Personal Tour Guide
Ask me questions while you tour the home.