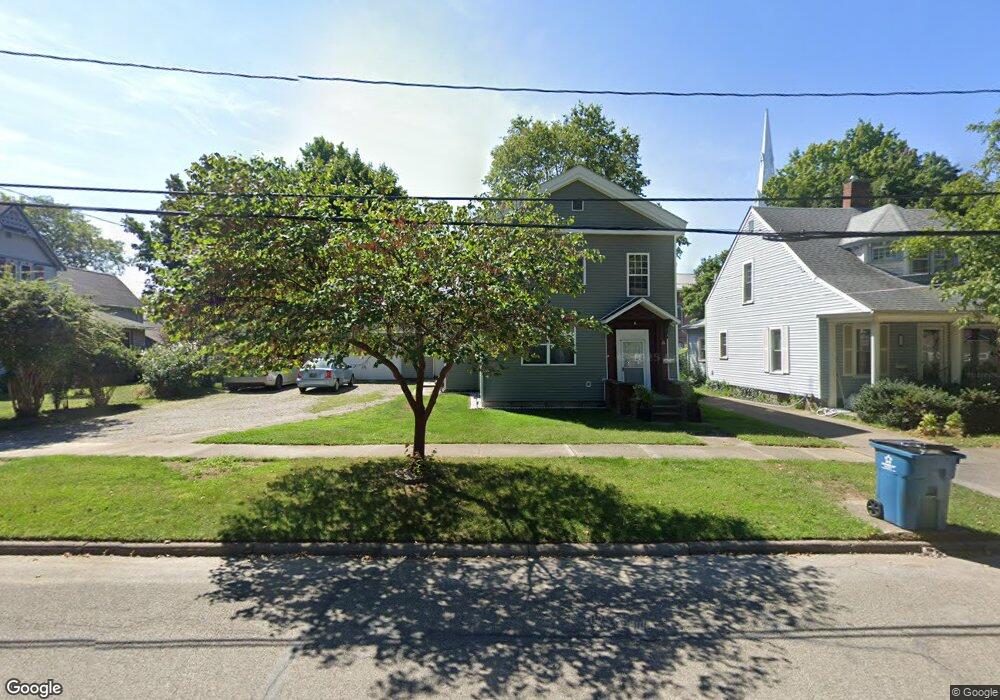
26 Hull St Coldwater, MI 49036
Estimated Value: $163,000 - $242,000
4
Beds
2
Baths
2,400
Sq Ft
$83/Sq Ft
Est. Value
About This Home
This home is located at 26 Hull St, Coldwater, MI 49036 and is currently estimated at $200,211, approximately $83 per square foot. 26 Hull St is a home located in Branch County with nearby schools including Coldwater High School, Pansophia Academy, and St. Charles Borromeo Catholic School.
Ownership History
Date
Name
Owned For
Owner Type
Purchase Details
Closed on
Feb 4, 2008
Sold by
Monarch Community Bank
Bought by
Aljabaly Omar Mohamed Kayd
Current Estimated Value
Home Financials for this Owner
Home Financials are based on the most recent Mortgage that was taken out on this home.
Original Mortgage
$55,800
Outstanding Balance
$35,454
Interest Rate
6.2%
Mortgage Type
Purchase Money Mortgage
Estimated Equity
$164,757
Purchase Details
Closed on
Nov 3, 1999
Sold by
Waters William and Waters Violet
Bought by
Rodesiler Christopher and Rodesiler Christina
Purchase Details
Closed on
Sep 10, 1998
Sold by
Waters William and Waters Violet
Bought by
Rodesiler Christopher and Rodesiler Christina
Purchase Details
Closed on
Dec 24, 1992
Sold by
Amsler Ronald and Amsler Phyllis
Bought by
Waters William and Waters Violet
Purchase Details
Closed on
Sep 1, 1990
Sold by
Waters Wm
Purchase Details
Closed on
Jun 12, 1970
Sold by
Keeslar J
Create a Home Valuation Report for This Property
The Home Valuation Report is an in-depth analysis detailing your home's value as well as a comparison with similar homes in the area
Home Values in the Area
Average Home Value in this Area
Purchase History
| Date | Buyer | Sale Price | Title Company |
|---|---|---|---|
| Aljabaly Omar Mohamed Kayd | $62,000 | None Available | |
| Rodesiler Christopher | $65,000 | -- | |
| Rodesiler Christopher | $65,000 | -- | |
| Waters William | $23,000 | -- | |
| -- | $23,000 | -- | |
| -- | $14,000 | -- |
Source: Public Records
Mortgage History
| Date | Status | Borrower | Loan Amount |
|---|---|---|---|
| Open | Aljabaly Omar Mohamed Kayd | $55,800 |
Source: Public Records
Tax History
| Year | Tax Paid | Tax Assessment Tax Assessment Total Assessment is a certain percentage of the fair market value that is determined by local assessors to be the total taxable value of land and additions on the property. | Land | Improvement |
|---|---|---|---|---|
| 2025 | $1,850 | $96,250 | $0 | $0 |
| 2024 | $18 | $95,050 | $0 | $0 |
| 2023 | $1,241 | $89,500 | $0 | $0 |
| 2022 | $1,776 | $78,050 | $0 | $0 |
| 2020 | -- | $64,350 | $0 | $0 |
| 2019 | -- | $62,700 | $0 | $0 |
| 2018 | -- | $45,750 | $0 | $0 |
| 2017 | -- | $44,600 | $0 | $0 |
| 2016 | -- | $46,550 | $0 | $0 |
| 2015 | -- | $39,550 | $0 | $0 |
| 2014 | -- | $34,100 | $0 | $0 |
| 2013 | -- | $37,850 | $0 | $0 |
Source: Public Records
Map
Nearby Homes
- 122 N Hudson St
- 67 E Pierce St
- 36 E Alden St
- 53 E Pearl St
- 100 Taylor St
- 279 Marshall St
- 144 W Pearl St
- 10 Fairfield Dr
- 169 E Washington St
- 175 W Pearl St
- 134 S Clay St
- 40 Balfour Dr
- 184 S Clay St
- 195 Cutter Ave
- 56 Thompson Blvd
- 371 Marshall St
- 426 Morse St
- 200 S Clay St
- 61 N Polk St
- 150 W Clarke Ave
Your Personal Tour Guide
Ask me questions while you tour the home.