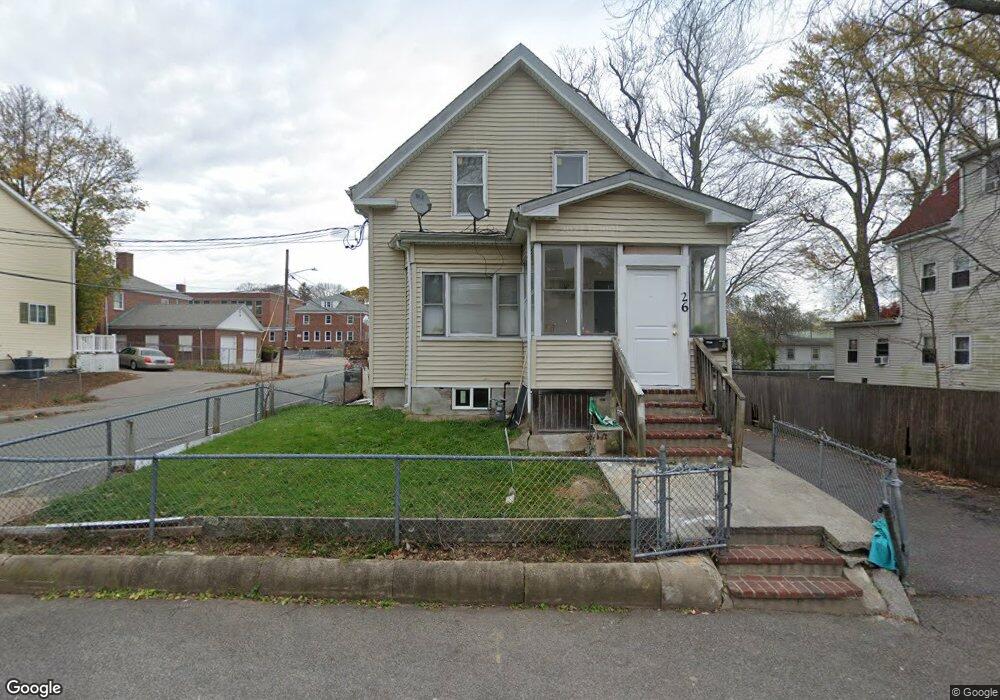
26 Hunt St Brockton, MA 02302
Estimated Value: $537,000 - $651,000
4
Beds
2
Baths
1,497
Sq Ft
$395/Sq Ft
Est. Value
About This Home
This home is located at 26 Hunt St, Brockton, MA 02302 and is currently estimated at $590,946, approximately $394 per square foot. 26 Hunt St is a home located in Plymouth County with nearby schools including Arnone Elementary School, Joseph F. Plouffe Middle School, and Brockton Area Seventh-Day Adventist Academy.
Ownership History
Date
Name
Owned For
Owner Type
Purchase Details
Closed on
Mar 3, 2022
Sold by
Teixeira Jose C
Bought by
Correia Jose A
Current Estimated Value
Purchase Details
Closed on
Jul 15, 2010
Sold by
Correia Jose A
Bought by
Teixeira Jose C
Home Financials for this Owner
Home Financials are based on the most recent Mortgage that was taken out on this home.
Original Mortgage
$138,139
Interest Rate
4.75%
Mortgage Type
FHA
Purchase Details
Closed on
May 29, 1998
Sold by
Lopes Manuel A and Lopes Ana M
Bought by
Correia Jose A
Purchase Details
Closed on
Jan 23, 1995
Sold by
Lucey Mary L Est
Bought by
Lopes Manuel A and Lopes Ana M
Create a Home Valuation Report for This Property
The Home Valuation Report is an in-depth analysis detailing your home's value as well as a comparison with similar homes in the area
Home Values in the Area
Average Home Value in this Area
Purchase History
| Date | Buyer | Sale Price | Title Company |
|---|---|---|---|
| Correia Jose A | -- | None Available | |
| Teixeira Jose C | $140,000 | -- | |
| Correia Jose A | $67,000 | -- | |
| Lopes Manuel A | $40,000 | -- |
Source: Public Records
Mortgage History
| Date | Status | Borrower | Loan Amount |
|---|---|---|---|
| Previous Owner | Teixeira Jose C | $138,139 | |
| Previous Owner | Lopes Manuel A | $277,500 | |
| Previous Owner | Lopes Manuel A | $260,000 | |
| Previous Owner | Lopes Manuel A | $190,000 |
Source: Public Records
Tax History Compared to Growth
Tax History
| Year | Tax Paid | Tax Assessment Tax Assessment Total Assessment is a certain percentage of the fair market value that is determined by local assessors to be the total taxable value of land and additions on the property. | Land | Improvement |
|---|---|---|---|---|
| 2025 | $6,862 | $566,600 | $134,900 | $431,700 |
| 2024 | $6,458 | $537,300 | $134,900 | $402,400 |
| 2023 | $5,846 | $450,400 | $101,200 | $349,200 |
| 2022 | $5,676 | $406,300 | $91,800 | $314,500 |
| 2021 | $4,863 | $335,400 | $75,700 | $259,700 |
| 2020 | $4,295 | $283,500 | $71,600 | $211,900 |
| 2019 | $4,375 | $281,500 | $68,900 | $212,600 |
| 2018 | $3,797 | $236,400 | $68,900 | $167,500 |
| 2017 | $3,247 | $201,700 | $68,900 | $132,800 |
| 2016 | $3,187 | $183,600 | $66,800 | $116,800 |
| 2015 | $2,781 | $153,200 | $66,800 | $86,400 |
| 2014 | $2,518 | $138,900 | $66,800 | $72,100 |
Source: Public Records
Map
Nearby Homes