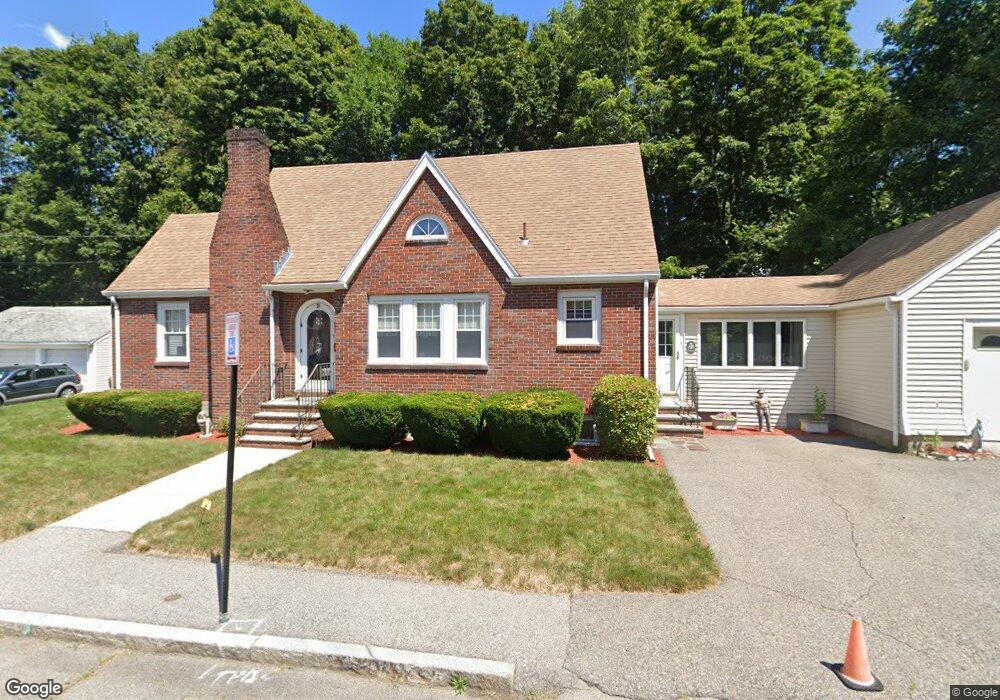
26 Hynes Ave Quincy, MA 02169
South Quincy NeighborhoodEstimated Value: $737,000 - $777,811
3
Beds
3
Baths
1,690
Sq Ft
$449/Sq Ft
Est. Value
About This Home
This home is located at 26 Hynes Ave, Quincy, MA 02169 and is currently estimated at $758,703, approximately $448 per square foot. 26 Hynes Ave is a home located in Norfolk County with nearby schools including South West Middle School, Lincoln-Hancock Community School, and Quincy High School.
Ownership History
Date
Name
Owned For
Owner Type
Purchase Details
Closed on
Nov 30, 2022
Sold by
Malvesti Thomas C and Malvesti Carol A
Bought by
Malvesti Nicholas M and Malvesti Michael T
Current Estimated Value
Purchase Details
Closed on
Sep 20, 1978
Bought by
Malvesti Thomas C
Create a Home Valuation Report for This Property
The Home Valuation Report is an in-depth analysis detailing your home's value as well as a comparison with similar homes in the area
Home Values in the Area
Average Home Value in this Area
Purchase History
| Date | Buyer | Sale Price | Title Company |
|---|---|---|---|
| Malvesti Nicholas M | -- | None Available | |
| Malvesti Thomas C | -- | -- |
Source: Public Records
Mortgage History
| Date | Status | Borrower | Loan Amount |
|---|---|---|---|
| Previous Owner | Malvesti Thomas C | $50,000 | |
| Previous Owner | Malvesti Thomas C | $151,000 | |
| Previous Owner | Malvesti Thomas C | $75,000 |
Source: Public Records
Tax History Compared to Growth
Tax History
| Year | Tax Paid | Tax Assessment Tax Assessment Total Assessment is a certain percentage of the fair market value that is determined by local assessors to be the total taxable value of land and additions on the property. | Land | Improvement |
|---|---|---|---|---|
| 2025 | $8,236 | $714,300 | $311,600 | $402,700 |
| 2024 | $7,844 | $696,000 | $296,800 | $399,200 |
| 2023 | $7,157 | $643,000 | $270,000 | $373,000 |
| 2022 | $7,123 | $594,600 | $225,200 | $369,400 |
| 2021 | $7,052 | $580,900 | $225,200 | $355,700 |
| 2020 | $7,249 | $583,200 | $225,200 | $358,000 |
| 2019 | $6,626 | $528,000 | $212,600 | $315,400 |
| 2018 | $6,667 | $499,800 | $197,000 | $302,800 |
| 2017 | $6,296 | $444,300 | $187,600 | $256,700 |
| 2016 | $5,754 | $400,700 | $163,400 | $237,300 |
| 2015 | $5,567 | $381,300 | $163,400 | $217,900 |
| 2014 | $5,219 | $351,200 | $163,400 | $187,800 |
Source: Public Records
Map
Nearby Homes
- 42 West St
- 57 Buckley St
- 46-48 Buckley St
- 211 Copeland St
- 510 Willard St
- 211 West St Unit 12B
- 14 Arthur Ave
- 21 Arthur St
- 12 Arthur Ave
- 46 Suomi Rd
- 46 Suomi Rd Unit 46
- 91 Garfield St
- 64 Garfield St Unit B
- 52 Bunker Hill Ln
- 63 Adele Rd
- 21 Totman St Unit 202
- 21 Totman St Unit 309
- 21 Totman St Unit Model-1
- 21 Totman St Unit 209
- 21 Totman St Unit 203
- 25 Hynes Ave
- 20 Hynes Ave
- 20 Hynes Ave Unit 3
- 45 Station St
- 19 Hynes Ave
- 31 Station St
- 31 Station St Unit 31
- 15 Hynes Ave
- 25 Station St
- 55 Station St Unit 5
- 55 Station St Unit 3
- 55 Station St Unit 2
- 55 Station St Unit 1
- 55 Station St Unit 4
- 11 Hynes Ave Unit 2
- 11 Hynes Ave Unit 11
- 11 Hynes Ave
- 9 Hynes Ave
- 21 Station St
- 40 Station St