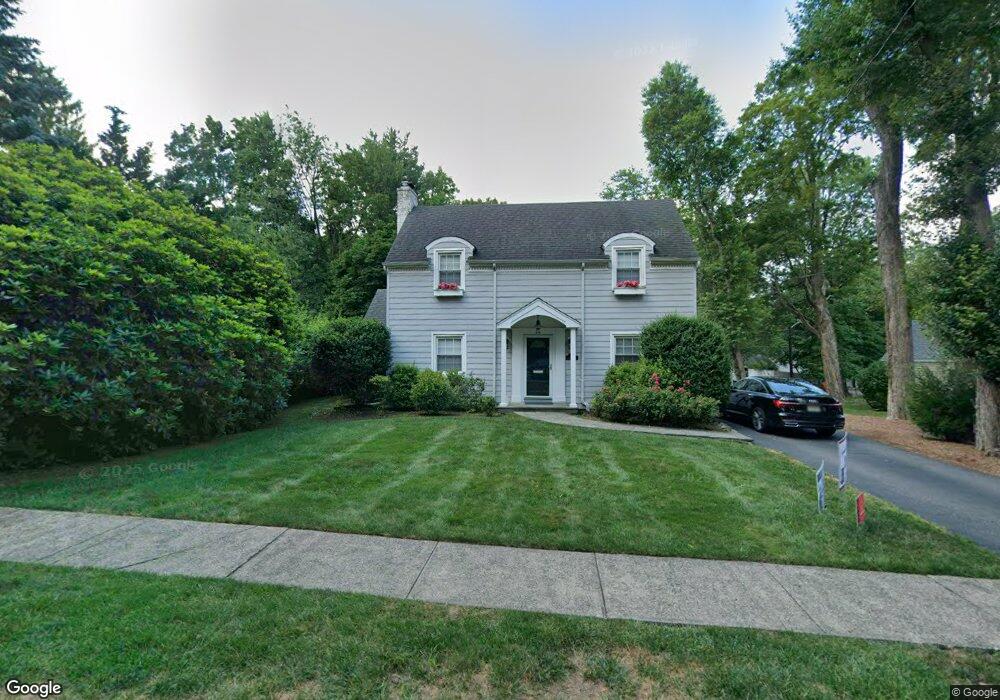
26 Iroquois Ave Allendale, NJ 07401
Estimated Value: $790,049 - $1,040,000
--
Bed
--
Bath
1,558
Sq Ft
$555/Sq Ft
Est. Value
About This Home
This home is located at 26 Iroquois Ave, Allendale, NJ 07401 and is currently estimated at $865,012, approximately $555 per square foot. 26 Iroquois Ave is a home located in Bergen County with nearby schools including Hillside Elementary School, Brookside Elementary School, and Northern Highlands Reg High School.
Ownership History
Date
Name
Owned For
Owner Type
Purchase Details
Closed on
Oct 13, 2005
Sold by
Pettinato Amy
Bought by
Chalfin Randall and Chalfin Teresa
Current Estimated Value
Home Financials for this Owner
Home Financials are based on the most recent Mortgage that was taken out on this home.
Original Mortgage
$498,000
Outstanding Balance
$265,880
Interest Rate
5.72%
Estimated Equity
$599,132
Purchase Details
Closed on
Apr 30, 2001
Sold by
Hancox Dudley
Bought by
Pettinato Amy M and Pettinato Charles
Home Financials for this Owner
Home Financials are based on the most recent Mortgage that was taken out on this home.
Original Mortgage
$190,000
Interest Rate
6.85%
Purchase Details
Closed on
Aug 16, 1995
Sold by
Robbin Dorothy
Bought by
Rouse Dudley and Rouse Jill
Home Financials for this Owner
Home Financials are based on the most recent Mortgage that was taken out on this home.
Original Mortgage
$223,000
Interest Rate
7.8%
Create a Home Valuation Report for This Property
The Home Valuation Report is an in-depth analysis detailing your home's value as well as a comparison with similar homes in the area
Home Values in the Area
Average Home Value in this Area
Purchase History
| Date | Buyer | Sale Price | Title Company |
|---|---|---|---|
| Chalfin Randall | $622,500 | -- | |
| Pettinato Amy M | $410,000 | -- | |
| Rouse Dudley | $247,900 | -- |
Source: Public Records
Mortgage History
| Date | Status | Borrower | Loan Amount |
|---|---|---|---|
| Open | Chalfin Randall | $498,000 | |
| Previous Owner | Pettinato Amy M | $190,000 | |
| Previous Owner | Rouse Dudley | $223,000 |
Source: Public Records
Tax History Compared to Growth
Tax History
| Year | Tax Paid | Tax Assessment Tax Assessment Total Assessment is a certain percentage of the fair market value that is determined by local assessors to be the total taxable value of land and additions on the property. | Land | Improvement |
|---|---|---|---|---|
| 2025 | $12,513 | $614,500 | $349,200 | $265,300 |
| 2024 | $12,528 | $593,300 | $334,200 | $259,100 |
| 2023 | $11,888 | $569,700 | $316,700 | $253,000 |
| 2022 | $10,670 | $468,600 | $291,700 | $176,900 |
| 2021 | $10,176 | $433,200 | $260,700 | $172,500 |
| 2020 | $10,108 | $418,900 | $255,700 | $163,200 |
| 2019 | $9,840 | $418,900 | $255,700 | $163,200 |
| 2018 | $9,622 | $418,900 | $255,700 | $163,200 |
| 2017 | $9,584 | $418,900 | $255,700 | $163,200 |
| 2016 | $9,597 | $418,900 | $255,700 | $163,200 |
| 2015 | $9,404 | $418,900 | $255,700 | $163,200 |
| 2014 | $9,339 | $391,900 | $240,700 | $151,200 |
Source: Public Records
Map
Nearby Homes
- 175 E Crescent Ave
- 10 Biscayne Dr
- 193 S Franklin Turnpike
- 3 Anne Ave
- 2 Allison Ct Unit C0002
- 17 Allison Ct
- 77 Myrtle Ave
- 132 Prospect St
- 5 Joseph Ct
- 6 Cottage Place
- 8 Garden Ct
- 8 Oratam Rd
- 48 Lake St
- 356 E Allendale Ave
- 14 Mechanic St
- 50 Elizabeth Terrace
- 48 Pleasant Ave
- 10 E Allendale Rd
- 45 W Orchard St
- 92 W Main St
- 32 Iroquois Ave
- 900 Franklin Turnpike
- 896 Franklin Turnpike
- 42 Iroquois Ave
- 21 Iroquois Ave
- 27 Iroquois Ave
- 876 Franklin Turnpike
- 50 Iroquois Ave
- 49 Iroquois Ave
- 17 Iroquois Ave
- 2 Montrose Terrace
- 42 Cherokee Ave
- 38 Cherokee Ave
- 54 Cherokee Ave
- 913 Franklin Turnpike
- 60 Cherokee Ave
- 26 Cherokee Ave
- 6 Montrose Terrace
- 66 Cherokee Ave
- 54 Iroquois Ave