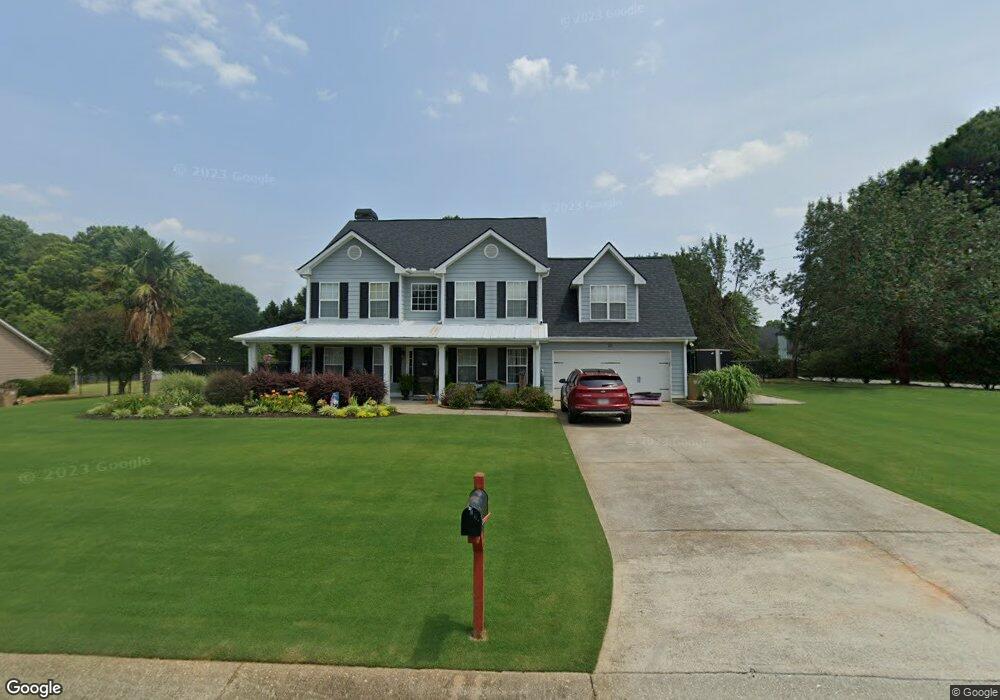
26 Jacksons Walk Jefferson, GA 30549
Estimated Value: $400,870 - $462,000
--
Bed
3
Baths
2,402
Sq Ft
$175/Sq Ft
Est. Value
About This Home
This home is located at 26 Jacksons Walk, Jefferson, GA 30549 and is currently estimated at $419,718, approximately $174 per square foot. 26 Jacksons Walk is a home located in Jackson County with nearby schools including South Jackson Elementary School, East Jackson Middle School, and East Jackson Comprehensive High School.
Ownership History
Date
Name
Owned For
Owner Type
Purchase Details
Closed on
Oct 30, 2015
Sold by
Boschert Catherine A
Bought by
Camp Christopher Gary
Current Estimated Value
Home Financials for this Owner
Home Financials are based on the most recent Mortgage that was taken out on this home.
Original Mortgage
$147,600
Outstanding Balance
$116,487
Interest Rate
3.89%
Mortgage Type
New Conventional
Estimated Equity
$303,231
Purchase Details
Closed on
Sep 24, 2004
Sold by
Rackley Construction Inc
Bought by
Boschert Catherine
Purchase Details
Closed on
Aug 6, 2003
Sold by
Thompson Russell D
Bought by
Rackley Construction Inc
Purchase Details
Closed on
Jan 8, 2003
Sold by
Copper Mary A
Bought by
Thompson Russell D
Create a Home Valuation Report for This Property
The Home Valuation Report is an in-depth analysis detailing your home's value as well as a comparison with similar homes in the area
Home Values in the Area
Average Home Value in this Area
Purchase History
| Date | Buyer | Sale Price | Title Company |
|---|---|---|---|
| Camp Christopher Gary | $184,500 | -- | |
| Boschert Catherine | $159,000 | -- | |
| Rackley Construction Inc | $30,500 | -- | |
| Thompson Russell D | $83,500 | -- |
Source: Public Records
Mortgage History
| Date | Status | Borrower | Loan Amount |
|---|---|---|---|
| Open | Camp Christopher Gary | $147,600 |
Source: Public Records
Tax History Compared to Growth
Tax History
| Year | Tax Paid | Tax Assessment Tax Assessment Total Assessment is a certain percentage of the fair market value that is determined by local assessors to be the total taxable value of land and additions on the property. | Land | Improvement |
|---|---|---|---|---|
| 2024 | $3,535 | $134,200 | $20,800 | $113,400 |
| 2023 | $3,511 | $121,920 | $20,800 | $101,120 |
| 2022 | $3,071 | $102,880 | $20,800 | $82,080 |
| 2021 | $2,916 | $96,880 | $14,800 | $82,080 |
| 2020 | $2,715 | $82,240 | $14,800 | $67,440 |
| 2019 | $2,755 | $82,240 | $14,800 | $67,440 |
| 2018 | $2,680 | $78,960 | $14,800 | $64,160 |
| 2017 | $2,453 | $71,475 | $14,800 | $56,675 |
| 2016 | $2,466 | $71,475 | $14,800 | $56,675 |
| 2015 | $2,241 | $66,675 | $10,000 | $56,675 |
| 2014 | $1,964 | $58,282 | $10,000 | $48,282 |
| 2013 | -- | $58,281 | $10,000 | $48,281 |
Source: Public Records
Map
Nearby Homes
- 26 Jacksons Walk Unit 11
- 2 Jacksons Walk
- 15 Jacksons Walk
- 33 Jacksons Walk
- 48 Jacksons Walk
- 61 Jacksons Walk
- 72 Jacksons Walk
- 14 Sparrow Ln
- 0 Sparrow Ln Unit 8744652
- 0 Sparrow Ln
- 1180 Jackson Trail Rd
- 44 Sparrow Ln
- 87 Jacksons Walk Unit 4
- 100 Jacksons Walk
- 146 Wren Ave
- 1295 Jackson Trail Rd
- 68 Sparrow Ln
- 4077 Winder Hwy
- 109 Jacksons Walk
- 75 Sparrow Ln