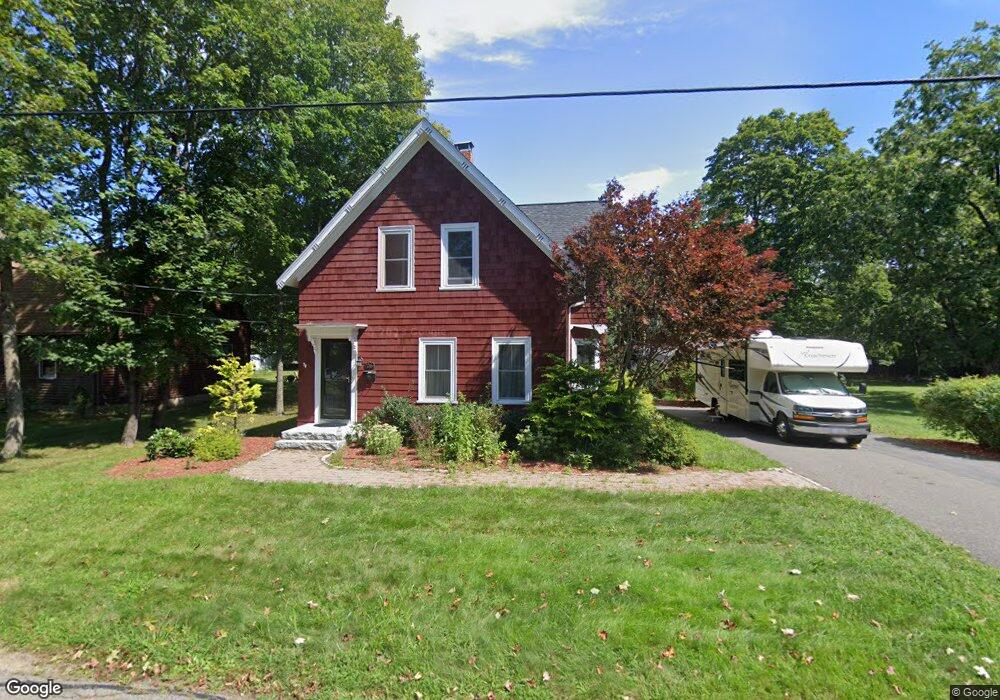
26 James St Mansfield, MA 02048
Estimated Value: $696,000 - $738,322
5
Beds
2
Baths
2,136
Sq Ft
$335/Sq Ft
Est. Value
About This Home
This home is located at 26 James St, Mansfield, MA 02048 and is currently estimated at $714,581, approximately $334 per square foot. 26 James St is a home located in Bristol County with nearby schools including Everett W. Robinson Elementary School, Jordan/Jackson Elementary School, and Harold L. Qualters Middle School.
Ownership History
Date
Name
Owned For
Owner Type
Purchase Details
Closed on
May 21, 2021
Sold by
Mcneil Susan M and Mcneil Kathryn A
Bought by
Farrell Janelle M
Current Estimated Value
Home Financials for this Owner
Home Financials are based on the most recent Mortgage that was taken out on this home.
Original Mortgage
$411,350
Outstanding Balance
$372,786
Interest Rate
3.1%
Mortgage Type
Purchase Money Mortgage
Estimated Equity
$341,795
Purchase Details
Closed on
Sep 22, 2000
Sold by
Chandler Thomas A and Hoogerzeil Eleanor M
Bought by
Mcneil Susan M and Mcneil Kathryn A
Home Financials for this Owner
Home Financials are based on the most recent Mortgage that was taken out on this home.
Original Mortgage
$159,920
Interest Rate
8%
Mortgage Type
Purchase Money Mortgage
Create a Home Valuation Report for This Property
The Home Valuation Report is an in-depth analysis detailing your home's value as well as a comparison with similar homes in the area
Home Values in the Area
Average Home Value in this Area
Purchase History
| Date | Buyer | Sale Price | Title Company |
|---|---|---|---|
| Farrell Janelle M | $433,000 | None Available | |
| Mcneil Susan M | $199,900 | -- |
Source: Public Records
Mortgage History
| Date | Status | Borrower | Loan Amount |
|---|---|---|---|
| Open | Farrell Janelle M | $411,350 | |
| Previous Owner | Mcneil Susan M | $50,000 | |
| Previous Owner | Mcneil Susan M | $159,920 |
Source: Public Records
Tax History Compared to Growth
Tax History
| Year | Tax Paid | Tax Assessment Tax Assessment Total Assessment is a certain percentage of the fair market value that is determined by local assessors to be the total taxable value of land and additions on the property. | Land | Improvement |
|---|---|---|---|---|
| 2025 | $8,321 | $631,800 | $280,700 | $351,100 |
| 2024 | $8,178 | $605,800 | $292,900 | $312,900 |
| 2023 | $7,988 | $566,900 | $292,900 | $274,000 |
| 2022 | $8,070 | $532,000 | $271,100 | $260,900 |
| 2021 | $6,851 | $446,000 | $226,000 | $220,000 |
| 2020 | $6,851 | $446,000 | $226,000 | $220,000 |
| 2019 | $5,956 | $391,300 | $188,200 | $203,100 |
| 2018 | $5,530 | $374,300 | $179,600 | $194,700 |
| 2017 | $5,036 | $335,300 | $174,500 | $160,800 |
| 2016 | $4,646 | $301,500 | $166,100 | $135,400 |
| 2015 | $4,411 | $284,600 | $166,100 | $118,500 |
Source: Public Records
Map
Nearby Homes
- 12 Wilson Place
- 21 East St Unit 1D
- 245 Willow St
- 16 East St Unit 2
- 14 School St
- 38 Court St
- 28 Court St
- 28 Court St Unit 4
- 72 Court St Unit B
- 76 Samoset Ave
- 241-243 N Main St
- 150 Rumford Ave Unit 222
- 34 Warren Ave
- 99 Pleasant St
- 22 Pleasant St Unit B
- 22 Pleasant St Unit A
- 82 Brook St
- 442 Ware St
- 460 Ware St
- 450 West St