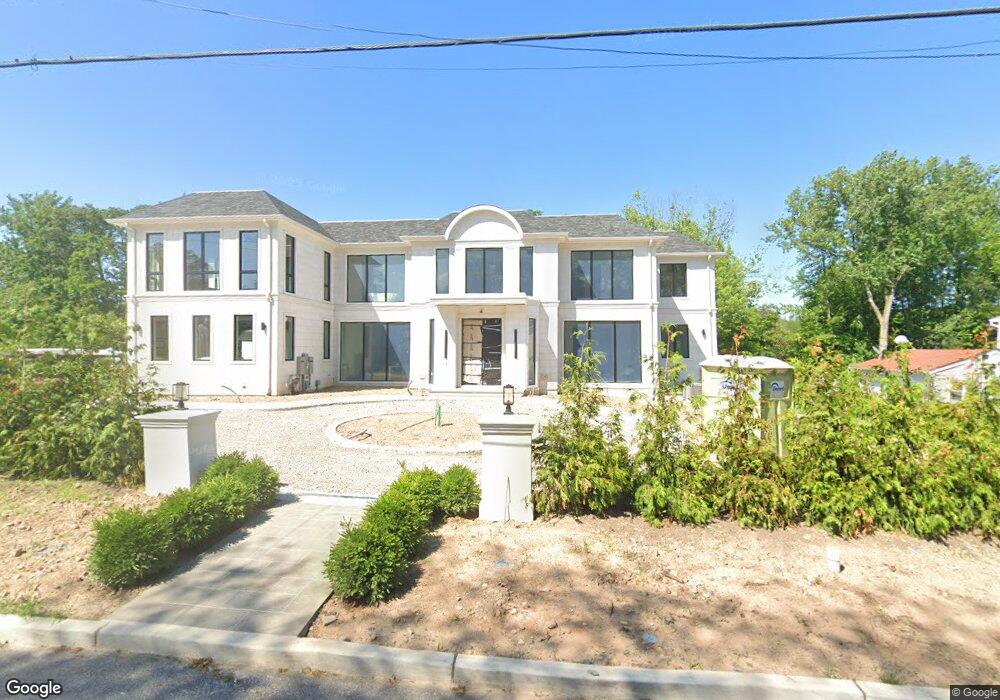
26 Jane Dr Englewood Cliffs, NJ 07632
Estimated Value: $2,625,000 - $2,811,884
--
Bed
--
Bath
3,224
Sq Ft
$843/Sq Ft
Est. Value
About This Home
This home is located at 26 Jane Dr, Englewood Cliffs, NJ 07632 and is currently estimated at $2,718,442, approximately $843 per square foot. 26 Jane Dr is a home located in Bergen County with nearby schools including Tenafly Middle School, Tenafly High School, and Englewood on the Palisades Charter School.
Ownership History
Date
Name
Owned For
Owner Type
Purchase Details
Closed on
Jun 14, 2023
Sold by
Jhalani Amit
Bought by
Jhalani Amit and Jhalani Vijay
Current Estimated Value
Purchase Details
Closed on
Mar 10, 2021
Sold by
Maddukuri Anil and Maddipati Reshma Surekha
Bought by
Jhalani Amit
Home Financials for this Owner
Home Financials are based on the most recent Mortgage that was taken out on this home.
Original Mortgage
$1,435,000
Interest Rate
3.1%
Mortgage Type
New Conventional
Purchase Details
Closed on
Jul 2, 2013
Sold by
Marcus Al P
Bought by
Maddukuri Anil
Home Financials for this Owner
Home Financials are based on the most recent Mortgage that was taken out on this home.
Original Mortgage
$1,380,000
Interest Rate
3.92%
Mortgage Type
Stand Alone Refi Refinance Of Original Loan
Create a Home Valuation Report for This Property
The Home Valuation Report is an in-depth analysis detailing your home's value as well as a comparison with similar homes in the area
Home Values in the Area
Average Home Value in this Area
Purchase History
| Date | Buyer | Sale Price | Title Company |
|---|---|---|---|
| Jhalani Amit | -- | None Listed On Document | |
| Jhalani Amit | $2,050,000 | Kct Abstract Llc | |
| Maddukuri Anil | $1,840,000 | -- |
Source: Public Records
Mortgage History
| Date | Status | Borrower | Loan Amount |
|---|---|---|---|
| Previous Owner | Jhalani Amit | $1,435,000 | |
| Previous Owner | Maddukuri Anil | $1,380,000 |
Source: Public Records
Tax History Compared to Growth
Tax History
| Year | Tax Paid | Tax Assessment Tax Assessment Total Assessment is a certain percentage of the fair market value that is determined by local assessors to be the total taxable value of land and additions on the property. | Land | Improvement |
|---|---|---|---|---|
| 2025 | $16,459 | $1,425,000 | $1,425,000 | -- |
| 2024 | $16,259 | $1,425,000 | $1,425,000 | $0 |
| 2023 | $16,003 | $1,425,000 | $1,425,000 | $0 |
| 2022 | $16,003 | $1,425,000 | $1,425,000 | $0 |
| 2021 | $19,225 | $1,778,400 | $1,425,000 | $353,400 |
| 2020 | $20,469 | $1,778,400 | $1,425,000 | $353,400 |
| 2019 | $19,225 | $1,778,400 | $1,425,000 | $353,400 |
| 2018 | $18,549 | $1,778,400 | $1,425,000 | $353,400 |
| 2017 | $17,748 | $1,778,400 | $1,425,000 | $353,400 |
| 2016 | $17,411 | $1,778,400 | $1,425,000 | $353,400 |
| 2015 | $16,539 | $1,778,400 | $1,425,000 | $353,400 |
| 2014 | $15,472 | $1,778,400 | $1,425,000 | $353,400 |
Source: Public Records
Map
Nearby Homes