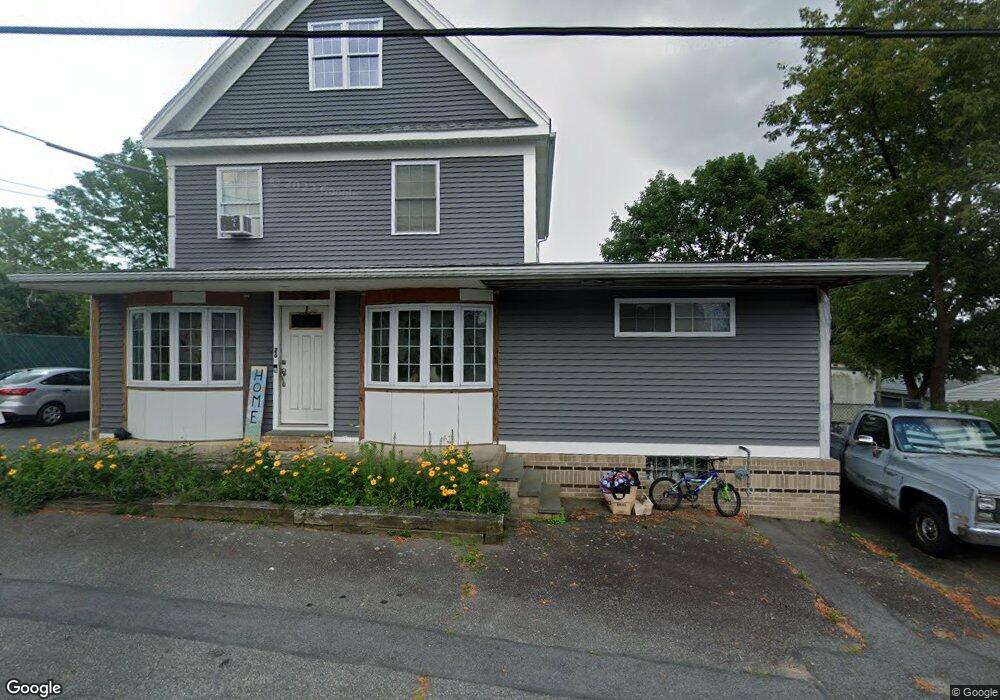
26 Jean St Acushnet, MA 02743
Estimated Value: $457,000 - $585,000
6
Beds
2
Baths
3,670
Sq Ft
$137/Sq Ft
Est. Value
About This Home
This home is located at 26 Jean St, Acushnet, MA 02743 and is currently estimated at $501,464, approximately $136 per square foot. 26 Jean St is a home located in Bristol County with nearby schools including Acushnet Elementary School, Albert F Ford Middle School, and Alma Del Mar Charter School.
Ownership History
Date
Name
Owned For
Owner Type
Purchase Details
Closed on
Apr 22, 2022
Sold by
Harney Heidi
Bought by
Fonseca Heidi and Fonseca John
Current Estimated Value
Purchase Details
Closed on
Jun 21, 2006
Sold by
Harney Heidi and Fonseca Irma P
Bought by
Harney Heidi
Home Financials for this Owner
Home Financials are based on the most recent Mortgage that was taken out on this home.
Original Mortgage
$254,560
Interest Rate
6.59%
Mortgage Type
Purchase Money Mortgage
Create a Home Valuation Report for This Property
The Home Valuation Report is an in-depth analysis detailing your home's value as well as a comparison with similar homes in the area
Home Values in the Area
Average Home Value in this Area
Purchase History
| Date | Buyer | Sale Price | Title Company |
|---|---|---|---|
| Fonseca Heidi | -- | None Available | |
| Harney Heidi | -- | -- | |
| Harney Heidi | -- | -- |
Source: Public Records
Mortgage History
| Date | Status | Borrower | Loan Amount |
|---|---|---|---|
| Previous Owner | Harney Heidi | $288,000 | |
| Previous Owner | Harney Heidi | $254,560 |
Source: Public Records
Tax History
| Year | Tax Paid | Tax Assessment Tax Assessment Total Assessment is a certain percentage of the fair market value that is determined by local assessors to be the total taxable value of land and additions on the property. | Land | Improvement |
|---|---|---|---|---|
| 2025 | $50 | $461,800 | $89,900 | $371,900 |
| 2024 | $4,467 | $391,500 | $85,700 | $305,800 |
| 2023 | $4,393 | $366,100 | $77,300 | $288,800 |
| 2022 | $4,415 | $332,700 | $73,200 | $259,500 |
| 2021 | $4,153 | $300,300 | $73,200 | $227,100 |
| 2020 | $4,186 | $300,300 | $73,200 | $227,100 |
| 2019 | $3,697 | $260,700 | $64,800 | $195,900 |
| 2018 | $2,341 | $260,700 | $64,800 | $195,900 |
| 2017 | $3,610 | $250,000 | $64,800 | $185,200 |
| 2016 | $3,486 | $239,900 | $64,800 | $175,100 |
| 2015 | $3,426 | $239,900 | $64,800 | $175,100 |
Source: Public Records
Map
Nearby Homes
Your Personal Tour Guide
Ask me questions while you tour the home.