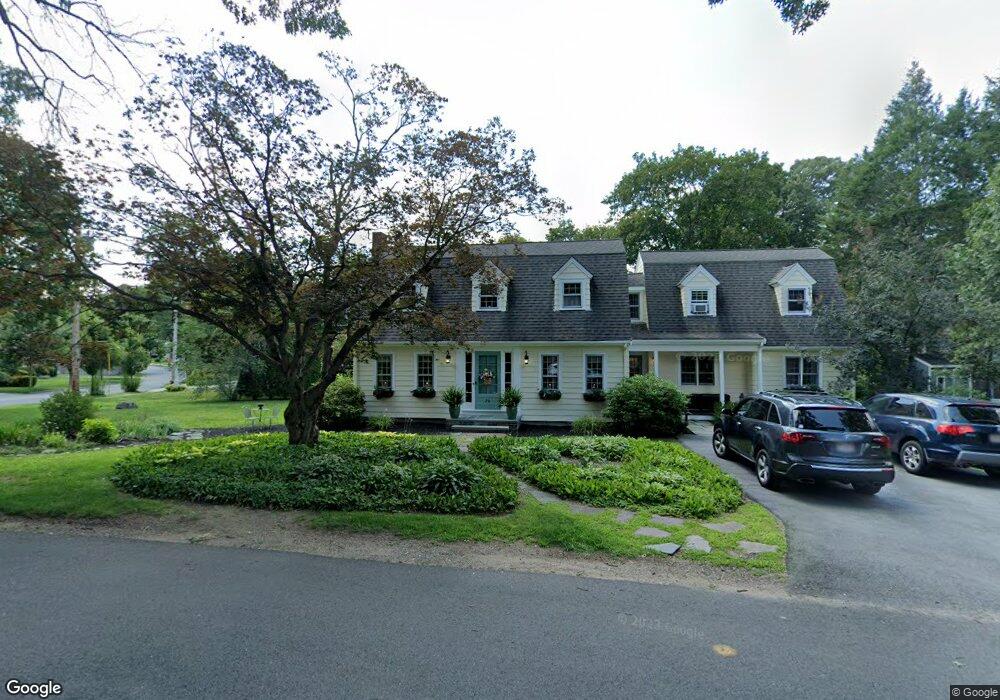
26 John Carver Rd Reading, MA 01867
Estimated Value: $940,000 - $1,092,000
4
Beds
4
Baths
2,076
Sq Ft
$480/Sq Ft
Est. Value
About This Home
This home is located at 26 John Carver Rd, Reading, MA 01867 and is currently estimated at $996,169, approximately $479 per square foot. 26 John Carver Rd is a home located in Middlesex County with nearby schools including Birch Meadow Elementary School, Arthur W. Coolidge Middle School, and Reading Memorial High School.
Ownership History
Date
Name
Owned For
Owner Type
Purchase Details
Closed on
Aug 2, 2002
Sold by
Jeffrey Judith M
Bought by
Bowen Robert M and Bowen Anne L
Current Estimated Value
Home Financials for this Owner
Home Financials are based on the most recent Mortgage that was taken out on this home.
Original Mortgage
$293,300
Interest Rate
6.64%
Mortgage Type
Purchase Money Mortgage
Purchase Details
Closed on
Jul 30, 1993
Sold by
Willcox S5even L and Willcox Elizabeth A
Bought by
Jeddrey James R and Jeddrey Judith M
Home Financials for this Owner
Home Financials are based on the most recent Mortgage that was taken out on this home.
Original Mortgage
$176,000
Interest Rate
7.32%
Mortgage Type
Purchase Money Mortgage
Purchase Details
Closed on
Sep 23, 1988
Sold by
Magdalenski David
Bought by
Willcox Steven L
Create a Home Valuation Report for This Property
The Home Valuation Report is an in-depth analysis detailing your home's value as well as a comparison with similar homes in the area
Home Values in the Area
Average Home Value in this Area
Purchase History
| Date | Buyer | Sale Price | Title Company |
|---|---|---|---|
| Bowen Robert M | $419,000 | -- | |
| Jeddrey James R | $190,000 | -- | |
| Willcox Steven L | $194,000 | -- |
Source: Public Records
Mortgage History
| Date | Status | Borrower | Loan Amount |
|---|---|---|---|
| Open | Willcox Steven L | $40,000 | |
| Open | Willcox Steven L | $314,000 | |
| Closed | Bowen Robert M | $293,300 | |
| Previous Owner | Willcox Steven L | $176,000 |
Source: Public Records
Tax History Compared to Growth
Tax History
| Year | Tax Paid | Tax Assessment Tax Assessment Total Assessment is a certain percentage of the fair market value that is determined by local assessors to be the total taxable value of land and additions on the property. | Land | Improvement |
|---|---|---|---|---|
| 2025 | $10,581 | $929,000 | $493,100 | $435,900 |
| 2024 | $10,460 | $892,500 | $473,700 | $418,800 |
| 2023 | $10,132 | $804,800 | $427,100 | $377,700 |
| 2022 | $9,754 | $731,700 | $388,300 | $343,400 |
| 2021 | $9,504 | $688,200 | $372,000 | $316,200 |
| 2020 | $8,998 | $645,000 | $354,000 | $291,000 |
| 2019 | $4,428 | $614,400 | $337,200 | $277,200 |
| 2018 | $6,787 | $579,400 | $318,000 | $261,400 |
| 2017 | $7,670 | $546,700 | $300,000 | $246,700 |
| 2016 | $7,253 | $500,200 | $271,000 | $229,200 |
| 2015 | $7,002 | $476,300 | $258,000 | $218,300 |
| 2014 | $6,531 | $443,100 | $240,000 | $203,100 |
Source: Public Records
Map
Nearby Homes
- 42 Winthrop Ave
- 195 Lowell St
- 99 Grove St
- 856 Main St
- 863 Main St
- 25 Martin Rd
- 28 Martin Rd
- 77 Mount Vernon St
- 33 Marla Ln
- 16 Glen Rd
- 52 Sanborn St Unit 408
- 103 High St
- 1 Charles St Unit N
- 5 Washington St Unit B2
- 52 Salem St
- 444 Lowell St
- 3 Bradford Rd
- 452 Lowell St
- 101 King St Unit 101
- 23 Covey Hill Rd
- 34 Puritan Rd
- 10 Harvard St
- 34 John Carver Rd
- 23 John Carver Rd
- 29 John Carver Rd
- 28 Puritan Rd
- 33 Puritan Rd
- 14 Harvard St
- 41 Puritan Rd
- 66 Winthrop Ave
- 25 Puritan Rd
- 24 Puritan Rd
- 72 Winthrop Ave
- 10 John Carver Rd
- 11 John Carver Rd
- 39 John Carver Rd
- 9 Harvard St
- 60 Winthrop Ave
- 22 Harvard St
- 42 John Carver Rd