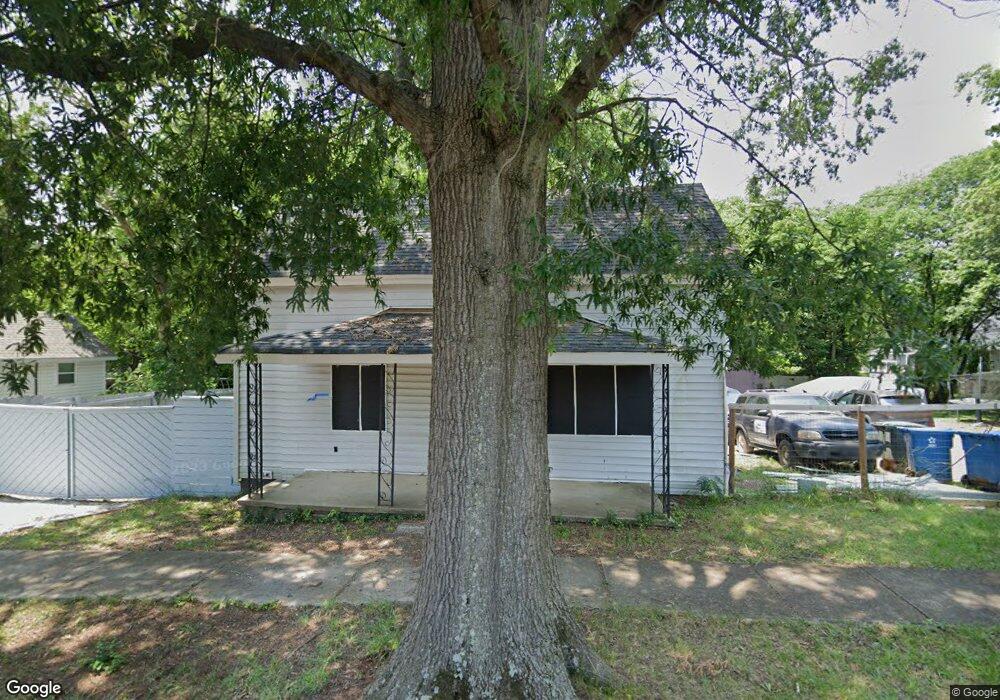
26 Knox St Salisbury, NC 28144
Estimated Value: $111,000 - $195,000
3
Beds
1
Bath
1,070
Sq Ft
$140/Sq Ft
Est. Value
About This Home
This home is located at 26 Knox St, Salisbury, NC 28144 and is currently estimated at $149,855, approximately $140 per square foot. 26 Knox St is a home located in Rowan County with nearby schools including Elizabeth Duncan Koontz Elementary School, North Rowan Middle School, and Salisbury High School.
Ownership History
Date
Name
Owned For
Owner Type
Purchase Details
Closed on
Jul 1, 2015
Sold by
Lagos Yanivy L
Bought by
Ochoa Paulina Vega
Current Estimated Value
Purchase Details
Closed on
Oct 7, 2009
Sold by
Federal Deposit Insurance Corporation
Bought by
Lagos Yanivy L
Purchase Details
Closed on
Jul 8, 2008
Sold by
Tyson James E
Bought by
Ameribank
Purchase Details
Closed on
May 7, 2007
Sold by
Rabon Michael
Bought by
Tyson James Earl
Home Financials for this Owner
Home Financials are based on the most recent Mortgage that was taken out on this home.
Original Mortgage
$61,248
Interest Rate
6.11%
Mortgage Type
Unknown
Purchase Details
Closed on
Mar 6, 2006
Sold by
Link Eugene
Bought by
Rabon Michael
Purchase Details
Closed on
Feb 28, 2006
Sold by
Rodgers Edward B
Bought by
Link Eugene
Create a Home Valuation Report for This Property
The Home Valuation Report is an in-depth analysis detailing your home's value as well as a comparison with similar homes in the area
Home Values in the Area
Average Home Value in this Area
Purchase History
| Date | Buyer | Sale Price | Title Company |
|---|---|---|---|
| Ochoa Paulina Vega | $6,000 | None Available | |
| Lagos Yanivy L | $6,500 | None Available | |
| Ameribank | $16,000 | None Available | |
| Tyson James Earl | $39,000 | Transnation Title Ins Co | |
| Rabon Michael | $10,000 | None Available | |
| Link Eugene | -- | None Available |
Source: Public Records
Mortgage History
| Date | Status | Borrower | Loan Amount |
|---|---|---|---|
| Previous Owner | Tyson James Earl | $61,248 |
Source: Public Records
Tax History
| Year | Tax Paid | Tax Assessment Tax Assessment Total Assessment is a certain percentage of the fair market value that is determined by local assessors to be the total taxable value of land and additions on the property. | Land | Improvement |
|---|---|---|---|---|
| 2025 | $1,077 | $90,081 | $17,549 | $72,532 |
| 2024 | $1,077 | $90,081 | $17,549 | $72,532 |
| 2023 | $365 | $30,501 | $17,549 | $12,952 |
| 2022 | $273 | $19,812 | $13,353 | $6,459 |
| 2021 | $273 | $19,812 | $13,353 | $6,459 |
| 2020 | $273 | $19,812 | $13,353 | $6,459 |
| 2019 | $273 | $19,812 | $13,353 | $6,459 |
| 2018 | $258 | $18,986 | $13,352 | $5,634 |
| 2017 | $257 | $18,986 | $13,352 | $5,634 |
| 2016 | $250 | $18,986 | $13,352 | $5,634 |
| 2015 | $251 | $18,986 | $13,352 | $5,634 |
| 2014 | $645 | $49,315 | $12,589 | $36,726 |
Source: Public Records
Map
Nearby Homes
- 7 Cooper St
- 101 Crawford St
- 328 Old Concord Rd
- 0 Martin Luther King Junior Ave S
- 115 W Thomas St
- 201 W McCubbins St
- 501 S Main St
- 406 S Shaver St
- 403 S Long St
- 817 S Jackson St
- 402 E Horah St Unit 35
- 0 Harrel St
- 420 E Bank St
- 603 S Fulton St
- 300 S Main St Unit K
- 420 S Jackson St
- 303 E Fisher St
- 409 E Fisher St
- 513 Lincolnton Rd
- 210 E Fisher St Unit 10
Your Personal Tour Guide
Ask me questions while you tour the home.