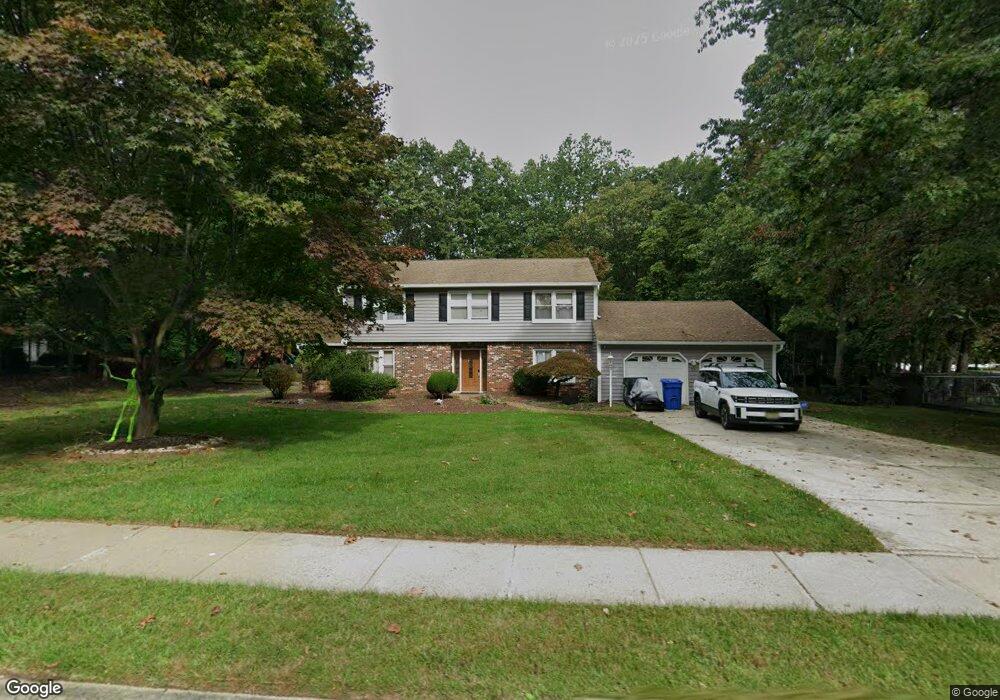
26 Lani St Monroe Township, NJ 08831
Estimated Value: $807,000 - $930,000
5
Beds
3
Baths
2,320
Sq Ft
$364/Sq Ft
Est. Value
About This Home
This home is located at 26 Lani St, Monroe Township, NJ 08831 and is currently estimated at $844,643, approximately $364 per square foot. 26 Lani St is a home located in Middlesex County with nearby schools including Mill Lake Elementary School, Woodland Elementary School, and Monroe Township Middle School.
Ownership History
Date
Name
Owned For
Owner Type
Purchase Details
Closed on
Jun 28, 2018
Sold by
Blotto Joseph A and Blotto Carol
Bought by
Lopesz Magdlanea and Lopesz Czarmel
Current Estimated Value
Home Financials for this Owner
Home Financials are based on the most recent Mortgage that was taken out on this home.
Original Mortgage
$495,853
Outstanding Balance
$429,731
Interest Rate
4.5%
Mortgage Type
FHA
Estimated Equity
$414,912
Create a Home Valuation Report for This Property
The Home Valuation Report is an in-depth analysis detailing your home's value as well as a comparison with similar homes in the area
Home Values in the Area
Average Home Value in this Area
Purchase History
| Date | Buyer | Sale Price | Title Company |
|---|---|---|---|
| Lopesz Magdlanea | $505,000 | Clear Skies Title Agency |
Source: Public Records
Mortgage History
| Date | Status | Borrower | Loan Amount |
|---|---|---|---|
| Open | Lopesz Magdlanea | $495,853 |
Source: Public Records
Tax History Compared to Growth
Tax History
| Year | Tax Paid | Tax Assessment Tax Assessment Total Assessment is a certain percentage of the fair market value that is determined by local assessors to be the total taxable value of land and additions on the property. | Land | Improvement |
|---|---|---|---|---|
| 2025 | $10,609 | $380,100 | $159,500 | $220,600 |
| 2024 | $10,240 | $380,100 | $159,500 | $220,600 |
| 2023 | $10,240 | $380,100 | $159,500 | $220,600 |
| 2022 | $10,080 | $380,100 | $159,500 | $220,600 |
| 2021 | $7,515 | $380,100 | $159,500 | $220,600 |
| 2020 | $10,027 | $380,100 | $159,500 | $220,600 |
| 2019 | $9,810 | $380,100 | $159,500 | $220,600 |
| 2018 | $9,734 | $380,100 | $159,500 | $220,600 |
| 2017 | $9,544 | $380,100 | $159,500 | $220,600 |
| 2016 | $9,404 | $380,100 | $159,500 | $220,600 |
| 2015 | $9,138 | $380,100 | $159,500 | $220,600 |
| 2014 | $8,765 | $380,100 | $159,500 | $220,600 |
Source: Public Records
Map
Nearby Homes