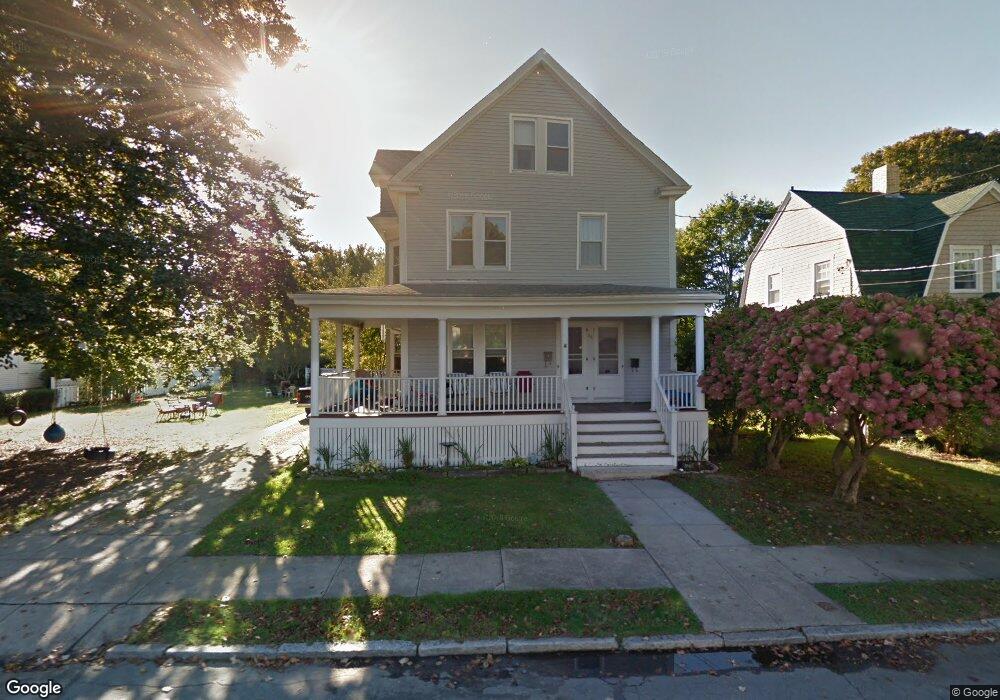
26 Laurel St Fairhaven, MA 02719
Estimated Value: $500,000 - $563,667
6
Beds
2
Baths
2,664
Sq Ft
$199/Sq Ft
Est. Value
About This Home
This home is located at 26 Laurel St, Fairhaven, MA 02719 and is currently estimated at $531,417, approximately $199 per square foot. 26 Laurel St is a home located in Bristol County with nearby schools including Fairhaven High School, City On A Hill Charter Public School New Bedford, and St. Joseph School.
Ownership History
Date
Name
Owned For
Owner Type
Purchase Details
Closed on
Jun 16, 2009
Sold by
Hadley Mary E
Bought by
Hadley Mary E and Hadley Mark D
Current Estimated Value
Home Financials for this Owner
Home Financials are based on the most recent Mortgage that was taken out on this home.
Original Mortgage
$208,250
Outstanding Balance
$131,930
Interest Rate
4.82%
Mortgage Type
Purchase Money Mortgage
Estimated Equity
$399,487
Purchase Details
Closed on
Apr 22, 2008
Sold by
Holmes Sandra D
Bought by
Hadley Mary E
Create a Home Valuation Report for This Property
The Home Valuation Report is an in-depth analysis detailing your home's value as well as a comparison with similar homes in the area
Home Values in the Area
Average Home Value in this Area
Purchase History
| Date | Buyer | Sale Price | Title Company |
|---|---|---|---|
| Hadley Mary E | -- | -- | |
| Hadley Mary E | -- | -- |
Source: Public Records
Mortgage History
| Date | Status | Borrower | Loan Amount |
|---|---|---|---|
| Open | Hadley Mary E | $208,250 | |
| Previous Owner | Hadley Mary E | $100,000 |
Source: Public Records
Tax History
| Year | Tax Paid | Tax Assessment Tax Assessment Total Assessment is a certain percentage of the fair market value that is determined by local assessors to be the total taxable value of land and additions on the property. | Land | Improvement |
|---|---|---|---|---|
| 2025 | $42 | $450,000 | $188,100 | $261,900 |
| 2024 | $4,071 | $441,100 | $188,100 | $253,000 |
| 2023 | $4,082 | $410,300 | $174,400 | $235,900 |
| 2022 | $3,950 | $386,500 | $166,200 | $220,300 |
| 2021 | $3,920 | $347,200 | $151,100 | $196,100 |
| 2020 | $3,764 | $340,300 | $144,200 | $196,100 |
| 2019 | $3,895 | $333,800 | $131,300 | $202,500 |
| 2018 | $3,625 | $316,600 | $125,000 | $191,600 |
| 2017 | $3,637 | $302,100 | $125,000 | $177,100 |
| 2016 | $3,497 | $287,100 | $125,000 | $162,100 |
| 2015 | $3,447 | $283,700 | $125,000 | $158,700 |
Source: Public Records
Map
Nearby Homes
- 32 Green St
- 32 Cedar St
- 11 Lawton St
- 2 Washburn Ave
- 24 Middle St
- 58 Washington St
- 0 Nulands Neck Unit 73286360
- 8 Washington St
- 145 Pleasant St
- 39 Christian St
- 8 Manor Dr
- 77 Adams St
- 67 Bridge St
- 181 Washington St
- 138 Main St Unit 13
- 58 Bayview Ave
- 48 Bellevue St
- 27 Bayview Ave
- 16 Ash St
- 15 Bayview Ave
Your Personal Tour Guide
Ask me questions while you tour the home.