Estimated Value: $382,000 - $429,000
5
Beds
3
Baths
3,565
Sq Ft
$114/Sq Ft
Est. Value
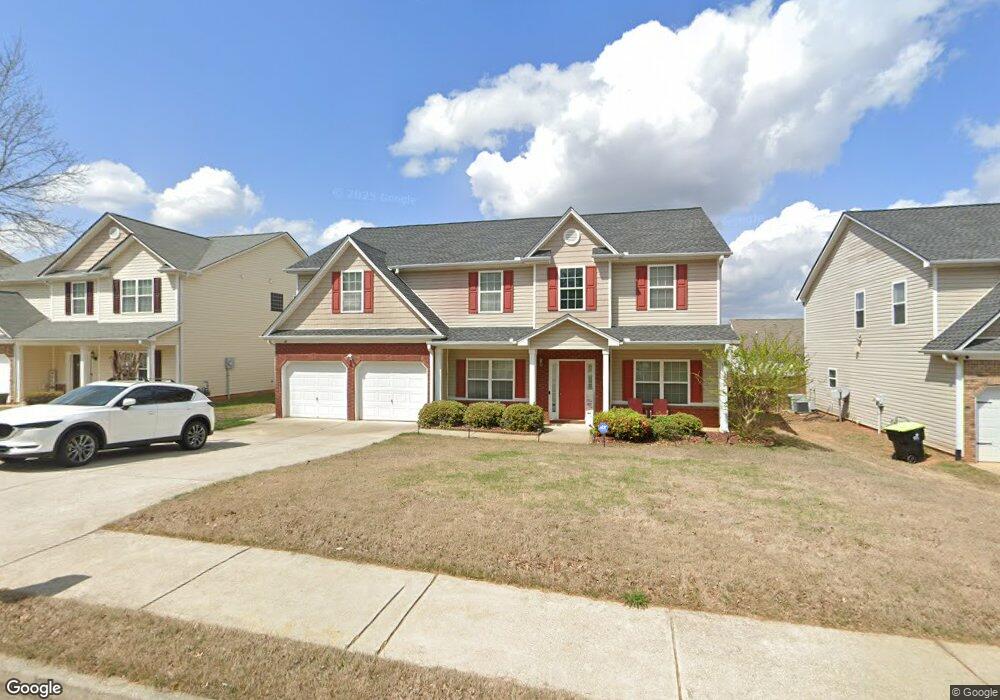
About This Home
This home is located at 26 Lenore Ct, Hiram, GA 30141 and is currently estimated at $405,795, approximately $113 per square foot. 26 Lenore Ct is a home located in Paulding County with nearby schools including Hiram Elementary School, P. B. Ritch Middle School, and Hiram High School.
Ownership History
Date
Name
Owned For
Owner Type
Purchase Details
Closed on
Feb 6, 2009
Sold by
Deutsche Bk Nat 2007-Br1
Bought by
Allen Samuel R and Allen Nicole
Current Estimated Value
Home Financials for this Owner
Home Financials are based on the most recent Mortgage that was taken out on this home.
Original Mortgage
$145,578
Outstanding Balance
$91,924
Interest Rate
5.08%
Mortgage Type
FHA
Estimated Equity
$313,871
Purchase Details
Closed on
Nov 4, 2008
Sold by
Smith Hudson S and Smith Octavia L
Bought by
Deutsche Bk Natl Trust 2007-Br
Purchase Details
Closed on
Oct 13, 2006
Sold by
Capri Homes Inc
Bought by
Smith Hudson S and Smith Octavia L
Home Financials for this Owner
Home Financials are based on the most recent Mortgage that was taken out on this home.
Original Mortgage
$225,398
Interest Rate
9.5%
Mortgage Type
New Conventional
Create a Home Valuation Report for This Property
The Home Valuation Report is an in-depth analysis detailing your home's value as well as a comparison with similar homes in the area
Home Values in the Area
Average Home Value in this Area
Purchase History
| Date | Buyer | Sale Price | Title Company |
|---|---|---|---|
| Allen Samuel R | $147,500 | -- | |
| Deutsche Bk Natl Trust 2007-Br | $191,088 | -- | |
| Smith Hudson S | $237,300 | -- |
Source: Public Records
Mortgage History
| Date | Status | Borrower | Loan Amount |
|---|---|---|---|
| Open | Allen Samuel R | $145,578 | |
| Previous Owner | Smith Hudson S | $225,398 |
Source: Public Records
Tax History Compared to Growth
Tax History
| Year | Tax Paid | Tax Assessment Tax Assessment Total Assessment is a certain percentage of the fair market value that is determined by local assessors to be the total taxable value of land and additions on the property. | Land | Improvement |
|---|---|---|---|---|
| 2024 | $3,778 | $155,120 | $16,000 | $139,120 |
| 2023 | $4,156 | $161,960 | $16,000 | $145,960 |
| 2022 | $3,558 | $138,356 | $12,000 | $126,356 |
| 2021 | $2,865 | $100,460 | $12,000 | $88,460 |
| 2020 | $2,670 | $91,748 | $12,000 | $79,748 |
| 2019 | $2,701 | $91,500 | $12,000 | $79,500 |
| 2018 | $2,466 | $83,728 | $8,000 | $75,728 |
| 2017 | $2,061 | $69,340 | $8,000 | $61,340 |
| 2016 | $2,113 | $71,760 | $8,000 | $63,760 |
| 2015 | $2,154 | $71,840 | $8,000 | $63,840 |
| 2014 | $1,887 | $61,640 | $8,000 | $53,640 |
| 2013 | -- | $48,600 | $8,000 | $40,600 |
Source: Public Records
Map
Nearby Homes
- 322 Lanier Ct
- 79 Kennedy Ct
- 143 Birch St
- 2393 Bill Carruth Pkwy
- 133 Willow Bend Dr
- 149 Willow Bend Dr
- 133 Willow Bend Rd
- 149 Willow Bend Rd
- 98 Baywood Way
- 3124 Hiram Sudie Rd
- 273 Baywood Crossing
- 552 Rich Davis Rd
- 7606 Nebo Rd
- 14 Berkten Ct
- 261 Township Dr
- 7799 Nebo Rd
- 7012 Nebo Rd
- 74 Bonds Ct
- 8060 Nebo Rd
- 8060 Nevo Rd