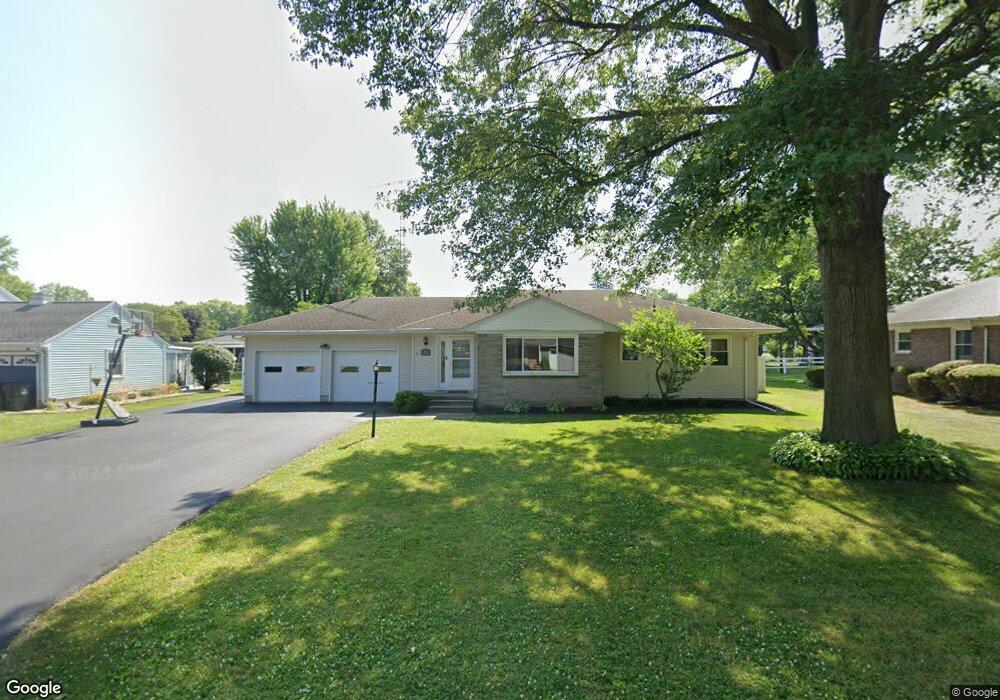
26 Lincoln Rd Tiffin, OH 44883
Estimated Value: $196,000 - $216,000
3
Beds
2
Baths
1,335
Sq Ft
$154/Sq Ft
Est. Value
About This Home
This home is located at 26 Lincoln Rd, Tiffin, OH 44883 and is currently estimated at $205,309, approximately $153 per square foot. 26 Lincoln Rd is a home located in Seneca County with nearby schools including Columbian High School, Bridges Community Academy, and Calvert High School.
Ownership History
Date
Name
Owned For
Owner Type
Purchase Details
Closed on
Oct 31, 2018
Sold by
Penwell Tessa L and Penwell Stacie
Bought by
Penwell Stacie S
Current Estimated Value
Home Financials for this Owner
Home Financials are based on the most recent Mortgage that was taken out on this home.
Original Mortgage
$65,000
Outstanding Balance
$49,208
Interest Rate
4.7%
Mortgage Type
Future Advance Clause Open End Mortgage
Estimated Equity
$156,101
Purchase Details
Closed on
Jan 19, 2017
Sold by
Penwell Tessa L and Miller Tessa L
Bought by
Penwell Stacie S and Penwell Tessa L
Purchase Details
Closed on
May 18, 2011
Sold by
Phares Richard A and Phares Robert E
Bought by
Penwell Stacie S and Miller Tessa L
Home Financials for this Owner
Home Financials are based on the most recent Mortgage that was taken out on this home.
Original Mortgage
$89,600
Interest Rate
4.81%
Mortgage Type
New Conventional
Purchase Details
Closed on
Oct 30, 2003
Sold by
Phares Chris
Bought by
Phares Chris C
Create a Home Valuation Report for This Property
The Home Valuation Report is an in-depth analysis detailing your home's value as well as a comparison with similar homes in the area
Home Values in the Area
Average Home Value in this Area
Purchase History
| Date | Buyer | Sale Price | Title Company |
|---|---|---|---|
| Penwell Stacie S | -- | None Available | |
| Penwell Stacie S | -- | None Available | |
| Penwell Stacie S | $112,000 | None Available | |
| Phares Chris C | -- | -- |
Source: Public Records
Mortgage History
| Date | Status | Borrower | Loan Amount |
|---|---|---|---|
| Open | Penwell Stacie S | $65,000 | |
| Closed | Penwell Stacie S | $89,600 |
Source: Public Records
Tax History Compared to Growth
Tax History
| Year | Tax Paid | Tax Assessment Tax Assessment Total Assessment is a certain percentage of the fair market value that is determined by local assessors to be the total taxable value of land and additions on the property. | Land | Improvement |
|---|---|---|---|---|
| 2024 | $1,840 | $54,540 | $11,840 | $42,700 |
| 2023 | $1,842 | $54,540 | $11,840 | $42,700 |
| 2022 | $1,770 | $43,500 | $11,140 | $32,360 |
| 2021 | $1,783 | $43,500 | $11,140 | $32,360 |
| 2020 | $1,817 | $43,502 | $11,137 | $32,365 |
| 2019 | $1,630 | $37,759 | $9,867 | $27,892 |
| 2018 | $1,634 | $37,759 | $9,867 | $27,892 |
| 2017 | $1,651 | $37,759 | $9,867 | $27,892 |
| 2016 | $1,605 | $37,619 | $9,867 | $27,752 |
| 2015 | $1,586 | $37,619 | $9,867 | $27,752 |
| 2014 | $1,494 | $37,619 | $9,867 | $27,752 |
| 2013 | $1,550 | $37,619 | $9,867 | $27,752 |
Source: Public Records
Map
Nearby Homes