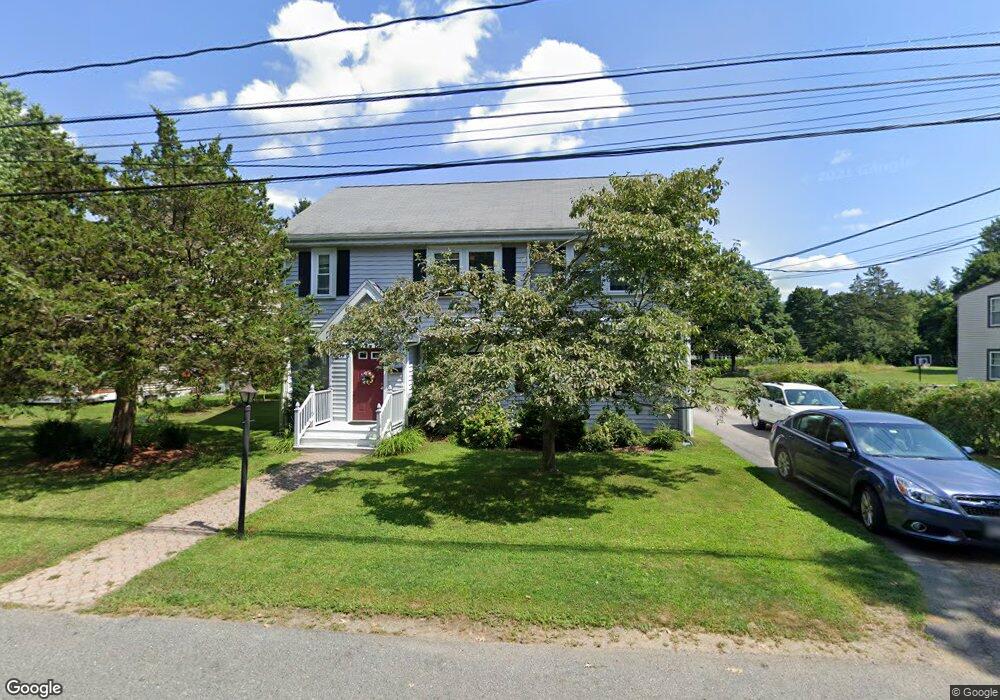
26 Loker St Natick, MA 01760
Estimated Value: $908,877 - $1,125,000
3
Beds
3
Baths
2,170
Sq Ft
$478/Sq Ft
Est. Value
About This Home
This home is located at 26 Loker St, Natick, MA 01760 and is currently estimated at $1,036,219, approximately $477 per square foot. 26 Loker St is a home located in Middlesex County with nearby schools including Natick High School, Wilson Middle School, and Bennett-Hemenway (Ben-Hem) Elementary School.
Ownership History
Date
Name
Owned For
Owner Type
Purchase Details
Closed on
Nov 16, 1993
Sold by
Hanna Est William A and Hanna Warren T
Bought by
Tobin Emily G and Babik David F
Current Estimated Value
Home Financials for this Owner
Home Financials are based on the most recent Mortgage that was taken out on this home.
Original Mortgage
$100,000
Interest Rate
6.79%
Mortgage Type
Purchase Money Mortgage
Create a Home Valuation Report for This Property
The Home Valuation Report is an in-depth analysis detailing your home's value as well as a comparison with similar homes in the area
Home Values in the Area
Average Home Value in this Area
Purchase History
| Date | Buyer | Sale Price | Title Company |
|---|---|---|---|
| Tobin Emily G | $125,000 | -- |
Source: Public Records
Mortgage History
| Date | Status | Borrower | Loan Amount |
|---|---|---|---|
| Closed | Tobin Emily G | $100,000 | |
| Previous Owner | Tobin Emily G | $20,000 |
Source: Public Records
Tax History Compared to Growth
Tax History
| Year | Tax Paid | Tax Assessment Tax Assessment Total Assessment is a certain percentage of the fair market value that is determined by local assessors to be the total taxable value of land and additions on the property. | Land | Improvement |
|---|---|---|---|---|
| 2025 | $9,125 | $763,000 | $438,100 | $324,900 |
| 2024 | $8,784 | $716,500 | $412,300 | $304,200 |
| 2023 | $8,650 | $684,300 | $395,700 | $288,600 |
| 2022 | $8,356 | $626,400 | $358,600 | $267,800 |
| 2021 | $6,087 | $588,500 | $338,100 | $250,400 |
| 2020 | $7,801 | $573,200 | $322,800 | $250,400 |
| 2019 | $9,020 | $573,200 | $322,800 | $250,400 |
| 2018 | $5,031 | $569,900 | $307,400 | $262,500 |
| 2017 | $7,039 | $521,800 | $264,200 | $257,600 |
| 2016 | $6,784 | $499,900 | $243,200 | $256,700 |
| 2015 | $6,580 | $476,100 | $243,200 | $232,900 |
Source: Public Records
Map
Nearby Homes