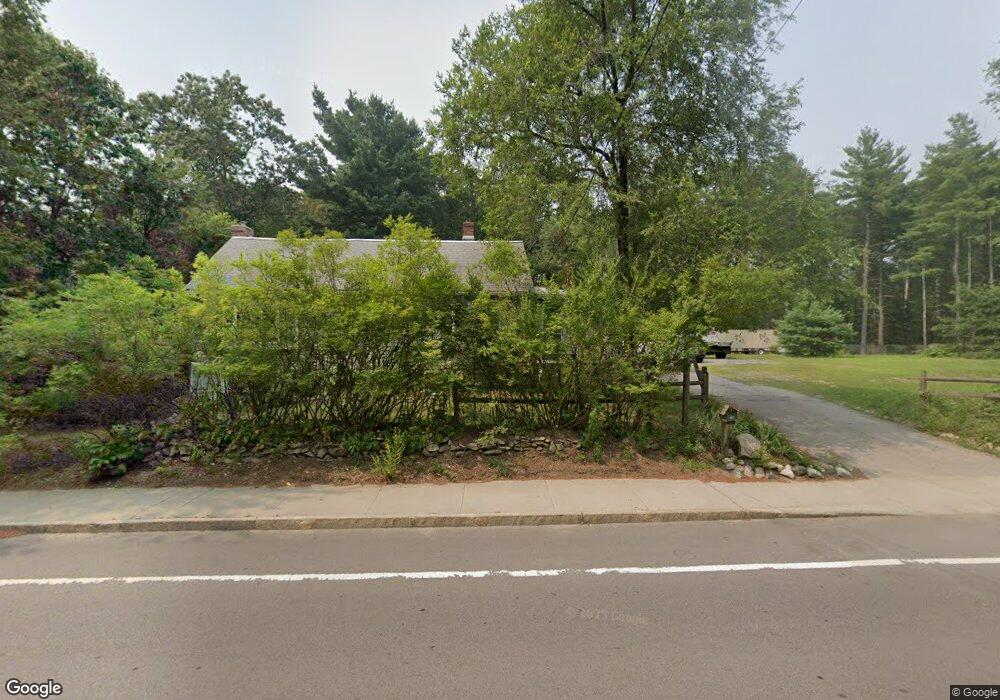
26 Main St Medway, MA 02053
Estimated Value: $591,000 - $653,000
3
Beds
2
Baths
2,406
Sq Ft
$260/Sq Ft
Est. Value
About This Home
This home is located at 26 Main St, Medway, MA 02053 and is currently estimated at $626,545, approximately $260 per square foot. 26 Main St is a home located in Norfolk County with nearby schools including John D. McGovern Elementary School, Burke-Memorial Elementary, and Medway Middle School.
Ownership History
Date
Name
Owned For
Owner Type
Purchase Details
Closed on
Aug 31, 2009
Sold by
Carlson Marilyn J and Carlson Anne M
Bought by
Rooney James E
Current Estimated Value
Home Financials for this Owner
Home Financials are based on the most recent Mortgage that was taken out on this home.
Original Mortgage
$225,223
Outstanding Balance
$147,145
Interest Rate
5.17%
Mortgage Type
Purchase Money Mortgage
Estimated Equity
$479,400
Create a Home Valuation Report for This Property
The Home Valuation Report is an in-depth analysis detailing your home's value as well as a comparison with similar homes in the area
Home Values in the Area
Average Home Value in this Area
Purchase History
| Date | Buyer | Sale Price | Title Company |
|---|---|---|---|
| Rooney James E | $233,000 | -- | |
| Carlson Marilyn J | -- | -- |
Source: Public Records
Mortgage History
| Date | Status | Borrower | Loan Amount |
|---|---|---|---|
| Open | Rooney James E | $225,223 |
Source: Public Records
Tax History Compared to Growth
Tax History
| Year | Tax Paid | Tax Assessment Tax Assessment Total Assessment is a certain percentage of the fair market value that is determined by local assessors to be the total taxable value of land and additions on the property. | Land | Improvement |
|---|---|---|---|---|
| 2025 | $6,931 | $486,400 | $277,300 | $209,100 |
| 2024 | $7,004 | $486,400 | $277,300 | $209,100 |
| 2023 | $6,907 | $433,300 | $242,500 | $190,800 |
| 2022 | $6,486 | $383,100 | $205,500 | $177,600 |
| 2021 | $6,242 | $357,500 | $185,900 | $171,600 |
| 2020 | $5,798 | $331,300 | $164,100 | $167,200 |
| 2019 | $5,402 | $318,300 | $155,400 | $162,900 |
| 2018 | $5,339 | $302,300 | $133,600 | $168,700 |
| 2017 | $5,365 | $299,400 | $133,600 | $165,800 |
| 2016 | $5,027 | $277,600 | $111,800 | $165,800 |
| 2015 | $5,171 | $283,500 | $111,800 | $171,700 |
| 2014 | $5,179 | $274,900 | $124,500 | $150,400 |
Source: Public Records
Map
Nearby Homes
- 50 Main St
- 3 Meryl St
- 106 Holliston St
- 12 Lovering St
- 1 Walnut Ln
- 22 Sunset Dr
- 20 Broad St Unit 6
- 20 Broad St Unit A
- 20 Broad St Unit 4
- 36 Lovering St
- 16 Lexington Ln
- 9 Sanford St
- 14 Heritage Dr
- 30 Broken Tree Rd
- 14 Sanford St Unit 15
- 2 Spencer St
- 280 Village St Unit D2
- 33 Spencer St
- 145 Acorn St
- 19 Sycamore Way Unit L40