26 Main St Quincy, MA 02169
Quincy Point NeighborhoodEstimated Value: $728,636 - $828,000
4
Beds
2
Baths
1,892
Sq Ft
$417/Sq Ft
Est. Value
About This Home
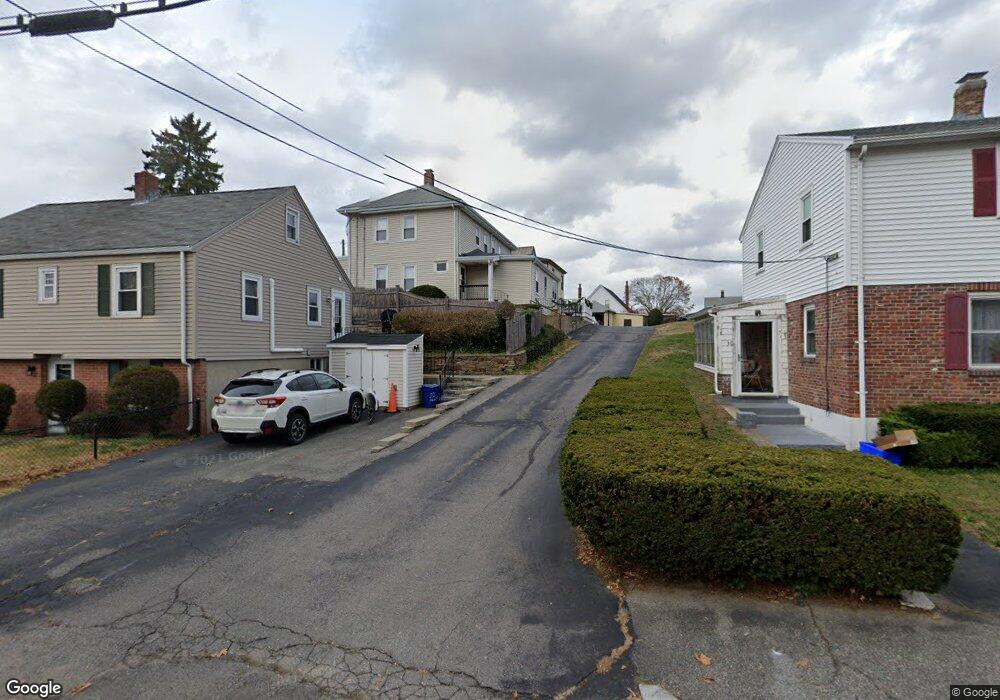
This home is located at 26 Main St, Quincy, MA 02169 and is currently estimated at $788,659, approximately $416 per square foot. 26 Main St is a home located in Norfolk County with nearby schools including Point Webster Middle School, Clifford H. Marshall Elementary School, and Quincy High School.
Ownership History
Date
Name
Owned For
Owner Type
Purchase Details
Closed on
Oct 30, 2019
Sold by
Franceschini John F and Franceschini Dale P
Bought by
Franceschini John and Franceschini Robin
Current Estimated Value
Purchase Details
Closed on
Nov 2, 2010
Sold by
Franceschini Olga A
Bought by
Franceschini Olga A and Franceschini John F
Purchase Details
Closed on
Oct 24, 1969
Bought by
Franceschini Olga A
Create a Home Valuation Report for This Property
The Home Valuation Report is an in-depth analysis detailing your home's value as well as a comparison with similar homes in the area
Home Values in the Area
Average Home Value in this Area
Purchase History
| Date | Buyer | Sale Price | Title Company |
|---|---|---|---|
| Franceschini John | -- | None Available | |
| Franceschini Olga A | -- | -- | |
| Franceschini Olga A | -- | -- |
Source: Public Records
Tax History
| Year | Tax Paid | Tax Assessment Tax Assessment Total Assessment is a certain percentage of the fair market value that is determined by local assessors to be the total taxable value of land and additions on the property. | Land | Improvement |
|---|---|---|---|---|
| 2025 | $7,533 | $653,300 | $311,700 | $341,600 |
| 2024 | $7,055 | $626,000 | $297,000 | $329,000 |
| 2023 | $6,482 | $582,400 | $270,300 | $312,100 |
| 2022 | $6,744 | $562,900 | $246,100 | $316,800 |
| 2021 | $6,407 | $527,800 | $246,100 | $281,700 |
| 2020 | $6,252 | $503,000 | $232,300 | $270,700 |
| 2019 | $6,049 | $482,000 | $215,300 | $266,700 |
| 2018 | $6,071 | $455,100 | $196,100 | $259,000 |
| 2017 | $6,058 | $427,500 | $186,900 | $240,600 |
| 2016 | $5,635 | $392,400 | $170,200 | $222,200 |
| 2015 | $5,322 | $364,500 | $160,700 | $203,800 |
| 2014 | $5,101 | $343,300 | $160,700 | $182,600 |
Source: Public Records
Map
Nearby Homes
- 5 Main St
- 72 Main St
- 35 Miller Stile Rd
- 44 Elm St
- 33 Elm St
- 66 Mcgrath Hwy Unit 302
- 66 Mcgrath Hwy Unit 402
- 66 Mcgrath Hwy Unit 309
- 66 Mcgrath Hwy Unit 201
- 51 Sumner St
- 59 Spear St Unit 201
- 59 Spear St Unit 302
- 59 Spear St Unit 402
- 59 Spear St Unit 202
- 59 Spear St Unit 301
- 101 Sumner St Unit B
- 2 Cliveden St Unit 601E
- 2 Cliveden St Unit 405E
- 18 Cliveden St Unit 406W
- 18 Cliveden St Unit 205W
Your Personal Tour Guide
Ask me questions while you tour the home.