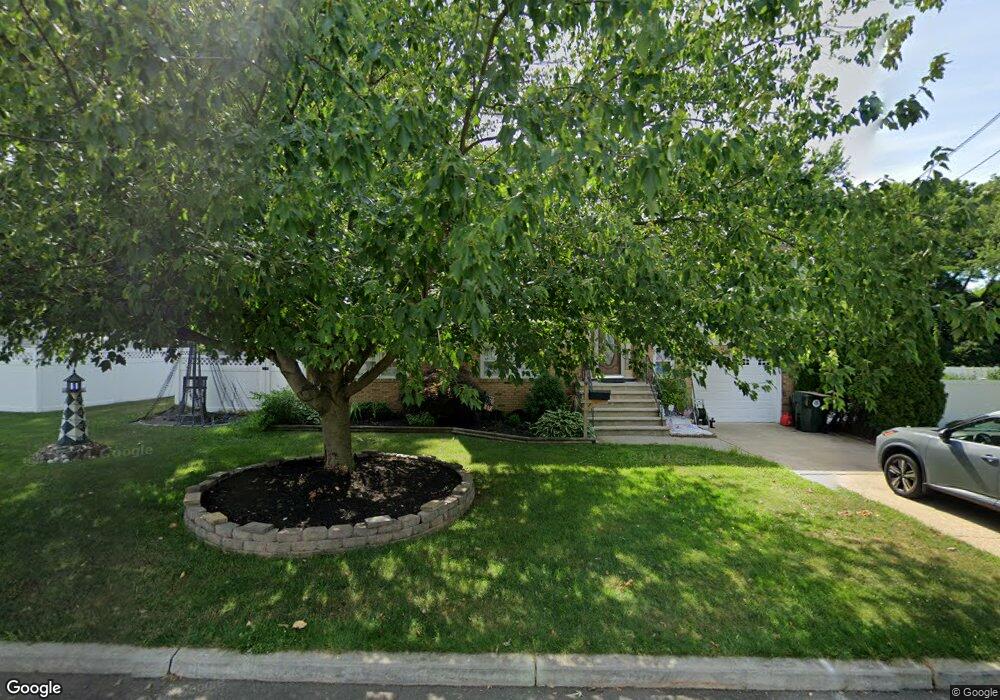
26 Maple Dr Hazlet, NJ 07730
Estimated Value: $590,000 - $681,000
5
Beds
2
Baths
1,882
Sq Ft
$336/Sq Ft
Est. Value
About This Home
This home is located at 26 Maple Dr, Hazlet, NJ 07730 and is currently estimated at $631,731, approximately $335 per square foot. 26 Maple Dr is a home located in Monmouth County with nearby schools including Raritan High School, St Benedict School, and St. Joseph Elementary School.
Ownership History
Date
Name
Owned For
Owner Type
Purchase Details
Closed on
Jun 29, 2007
Sold by
Pietrosh Joseph J and Pietrosh Frances
Bought by
Cahill John A and Cahill Jean L
Current Estimated Value
Home Financials for this Owner
Home Financials are based on the most recent Mortgage that was taken out on this home.
Original Mortgage
$319,500
Outstanding Balance
$198,548
Interest Rate
6.39%
Mortgage Type
Purchase Money Mortgage
Estimated Equity
$433,183
Create a Home Valuation Report for This Property
The Home Valuation Report is an in-depth analysis detailing your home's value as well as a comparison with similar homes in the area
Home Values in the Area
Average Home Value in this Area
Purchase History
| Date | Buyer | Sale Price | Title Company |
|---|---|---|---|
| Cahill John A | $355,000 | Transnation Title Ins Co |
Source: Public Records
Mortgage History
| Date | Status | Borrower | Loan Amount |
|---|---|---|---|
| Open | Cahill John A | $319,500 |
Source: Public Records
Tax History
| Year | Tax Paid | Tax Assessment Tax Assessment Total Assessment is a certain percentage of the fair market value that is determined by local assessors to be the total taxable value of land and additions on the property. | Land | Improvement |
|---|---|---|---|---|
| 2025 | $9,693 | $490,900 | $269,200 | $221,700 |
| 2024 | $9,488 | $460,900 | $240,200 | $220,700 |
| 2023 | $9,488 | $444,000 | $225,200 | $218,800 |
| 2022 | $8,965 | $383,800 | $191,200 | $192,600 |
| 2021 | $8,965 | $349,500 | $178,200 | $171,300 |
| 2020 | $8,823 | $341,700 | $174,200 | $167,500 |
| 2019 | $8,596 | $327,700 | $161,200 | $166,500 |
| 2018 | $8,329 | $314,900 | $156,200 | $158,700 |
| 2017 | $8,070 | $305,100 | $151,200 | $153,900 |
| 2016 | $7,937 | $301,200 | $151,200 | $150,000 |
| 2015 | $7,813 | $297,300 | $151,200 | $146,100 |
| 2014 | $7,691 | $274,500 | $135,200 | $139,300 |
Source: Public Records
Map
Nearby Homes
- 642 Holmdel Rd
- 1 Boyd Rd
- 7 Meadow Ct
- 627 Beers St
- 59 Ron Rd
- 52 Monique Cir
- 7 Kaylen Place
- 60 Bethany Rd
- 9 Parkview Dr
- 11 Chestnut Ridge Rd
- 47 Village Green Way
- 239 Lane c
- 46 Parkview Dr
- 34 Dartmouth Dr
- 8 Pine Creek Village
- 3 Duke Ln
- 788 Poole Ave
- 23 Cornell Dr
- 231 Atlantic St Unit 23
- 231 Atlantic St Unit 83
Your Personal Tour Guide
Ask me questions while you tour the home.