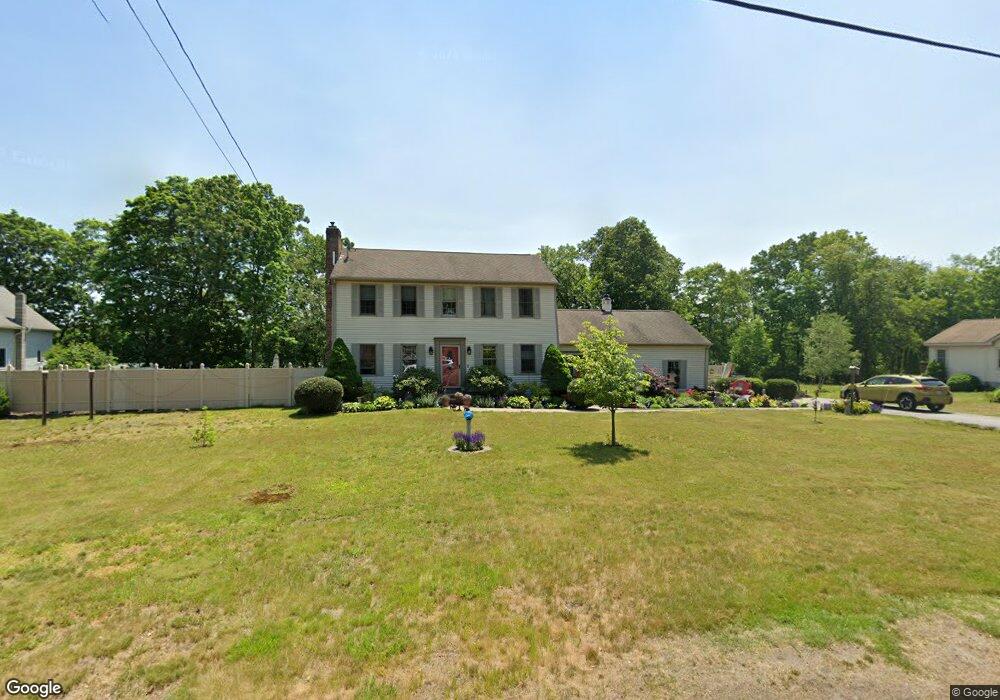
26 Maple St Uxbridge, MA 01569
Estimated Value: $580,386 - $690,000
3
Beds
3
Baths
2,210
Sq Ft
$280/Sq Ft
Est. Value
About This Home
This home is located at 26 Maple St, Uxbridge, MA 01569 and is currently estimated at $619,847, approximately $280 per square foot. 26 Maple St is a home located in Worcester County with nearby schools including Uxbridge High School, Whitinsville Christian School, and Our Lady of the Valley Regional School.
Ownership History
Date
Name
Owned For
Owner Type
Purchase Details
Closed on
Dec 12, 2007
Sold by
Judson Christine A and Karter Christine
Bought by
Judson Christine A and Karter Christine
Current Estimated Value
Home Financials for this Owner
Home Financials are based on the most recent Mortgage that was taken out on this home.
Original Mortgage
$35,000
Outstanding Balance
$22,154
Interest Rate
6.3%
Mortgage Type
Purchase Money Mortgage
Estimated Equity
$597,693
Purchase Details
Closed on
Feb 13, 2004
Sold by
Brevigleiri James M and Brevigleiri Nadine
Bought by
Judson Christine and Judson Mark A
Home Financials for this Owner
Home Financials are based on the most recent Mortgage that was taken out on this home.
Original Mortgage
$195,000
Interest Rate
5.82%
Mortgage Type
Purchase Money Mortgage
Create a Home Valuation Report for This Property
The Home Valuation Report is an in-depth analysis detailing your home's value as well as a comparison with similar homes in the area
Home Values in the Area
Average Home Value in this Area
Purchase History
| Date | Buyer | Sale Price | Title Company |
|---|---|---|---|
| Judson Christine A | -- | -- | |
| Judson Christine | $347,000 | -- |
Source: Public Records
Mortgage History
| Date | Status | Borrower | Loan Amount |
|---|---|---|---|
| Open | Judson Christine A | $35,000 | |
| Previous Owner | Judson Christine | $195,000 |
Source: Public Records
Tax History
| Year | Tax Paid | Tax Assessment Tax Assessment Total Assessment is a certain percentage of the fair market value that is determined by local assessors to be the total taxable value of land and additions on the property. | Land | Improvement |
|---|---|---|---|---|
| 2025 | $63 | $479,600 | $145,600 | $334,000 |
| 2024 | $5,968 | $461,900 | $138,100 | $323,800 |
| 2023 | $5,717 | $409,800 | $119,400 | $290,400 |
| 2022 | $5,245 | $346,000 | $104,500 | $241,500 |
| 2021 | $5,439 | $343,800 | $102,300 | $241,500 |
| 2020 | $5,990 | $357,800 | $99,900 | $257,900 |
| 2019 | $5,932 | $341,900 | $99,900 | $242,000 |
| 2018 | $5,685 | $331,100 | $99,900 | $231,200 |
| 2017 | $5,461 | $322,000 | $96,800 | $225,200 |
| 2016 | $5,519 | $314,100 | $84,800 | $229,300 |
| 2015 | $5,396 | $310,100 | $84,800 | $225,300 |
Source: Public Records
Map
Nearby Homes
- 12 Hartford Ave E
- 138 Elm St
- 3 Strathmore Shire Unit A
- 71 Rivulet St Unit B
- 26 Rivulet St
- 0 Homestead Ave
- 164 Heritage Dr Unit 164
- 125 Heritage Dr
- 235 Rivulet St
- 237 Heritage Dr Unit 237
- 240 Heritage Dr
- 288-290 Providence Rd
- 218 E Hartford Ave Unit 218
- 79 Country Club Dr
- 24 Olde Canal Way Unit 24
- 128 Linwood Ave
- 86 Hunter Rd
- 16 Farnum St
- 208-210 Church St
- 5 Peter St Unit D
Your Personal Tour Guide
Ask me questions while you tour the home.