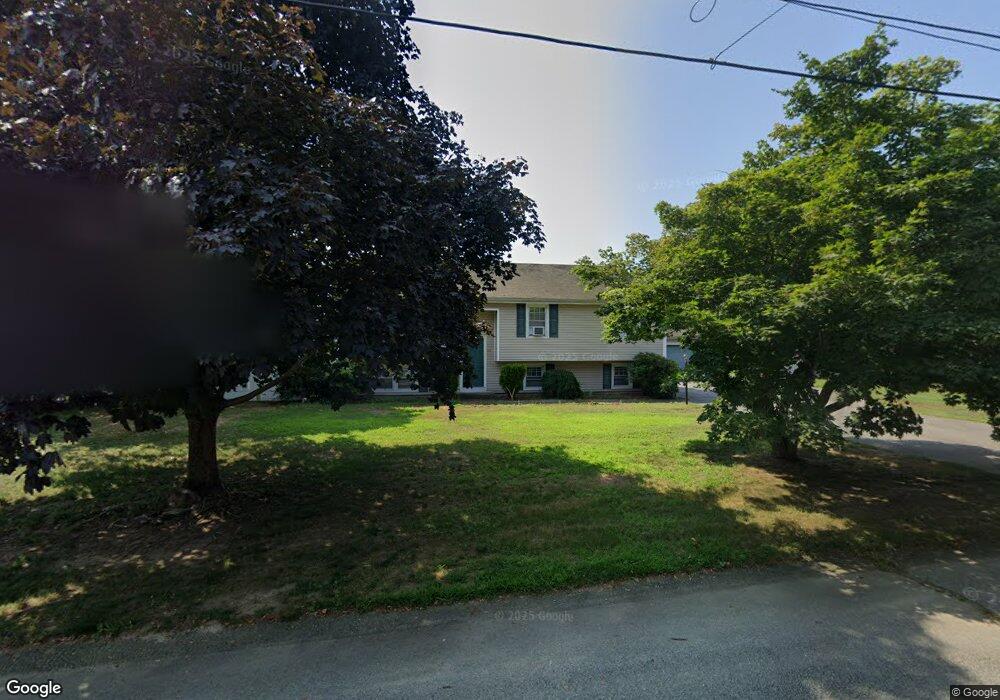
26 Marehaven Dr Seekonk, MA 02771
Estimated Value: $558,000 - $694,000
3
Beds
3
Baths
1,274
Sq Ft
$490/Sq Ft
Est. Value
About This Home
This home is located at 26 Marehaven Dr, Seekonk, MA 02771 and is currently estimated at $624,760, approximately $490 per square foot. 26 Marehaven Dr is a home located in Bristol County with nearby schools including Seekonk High School, The Gordon School, and St Mary Academy-Bay View.
Ownership History
Date
Name
Owned For
Owner Type
Purchase Details
Closed on
Mar 3, 2000
Sold by
Venditti Adrienne
Bought by
Santiago Aristides S and Santiago Eugenia B
Current Estimated Value
Home Financials for this Owner
Home Financials are based on the most recent Mortgage that was taken out on this home.
Original Mortgage
$152,000
Outstanding Balance
$51,218
Interest Rate
8.21%
Mortgage Type
Purchase Money Mortgage
Estimated Equity
$573,542
Create a Home Valuation Report for This Property
The Home Valuation Report is an in-depth analysis detailing your home's value as well as a comparison with similar homes in the area
Home Values in the Area
Average Home Value in this Area
Purchase History
| Date | Buyer | Sale Price | Title Company |
|---|---|---|---|
| Santiago Aristides S | $190,000 | -- |
Source: Public Records
Mortgage History
| Date | Status | Borrower | Loan Amount |
|---|---|---|---|
| Open | Santiago Aristides S | $152,000 |
Source: Public Records
Tax History Compared to Growth
Tax History
| Year | Tax Paid | Tax Assessment Tax Assessment Total Assessment is a certain percentage of the fair market value that is determined by local assessors to be the total taxable value of land and additions on the property. | Land | Improvement |
|---|---|---|---|---|
| 2025 | $5,929 | $480,100 | $157,900 | $322,200 |
| 2024 | $5,655 | $457,900 | $157,900 | $300,000 |
| 2023 | $5,542 | $422,700 | $141,700 | $281,000 |
| 2022 | $5,027 | $376,800 | $135,600 | $241,200 |
| 2021 | $4,854 | $357,700 | $120,400 | $237,300 |
| 2020 | $4,679 | $355,300 | $120,100 | $235,200 |
| 2019 | $4,524 | $346,400 | $120,100 | $226,300 |
| 2018 | $4,467 | $334,600 | $120,100 | $214,500 |
| 2017 | $4,319 | $320,900 | $114,900 | $206,000 |
| 2016 | $4,243 | $316,400 | $114,900 | $201,500 |
| 2015 | $4,107 | $310,400 | $114,900 | $195,500 |
Source: Public Records
Map
Nearby Homes