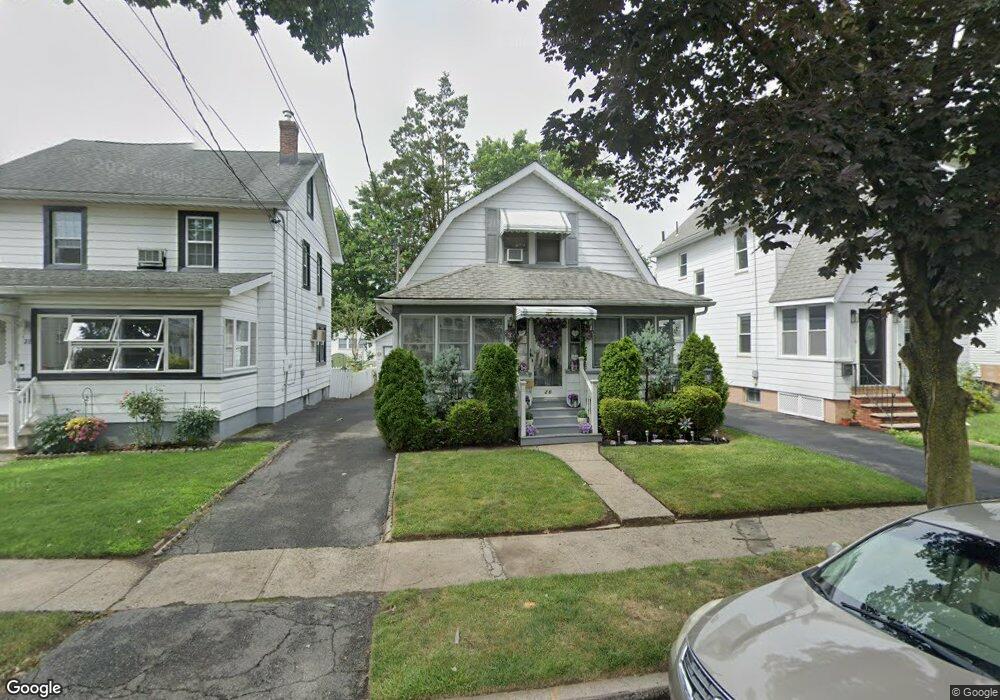
26 Martin St Bloomfield, NJ 07003
Estimated Value: $517,000 - $624,000
--
Bed
--
Bath
1,632
Sq Ft
$344/Sq Ft
Est. Value
About This Home
This home is located at 26 Martin St, Bloomfield, NJ 07003 and is currently estimated at $560,860, approximately $343 per square foot. 26 Martin St is a home located in Essex County with nearby schools including Demarest School, Bloomfield Middle School, and Bloomfield High School.
Ownership History
Date
Name
Owned For
Owner Type
Purchase Details
Closed on
Sep 23, 2004
Current Estimated Value
Purchase Details
Closed on
Jun 15, 1994
Sold by
Pistacchio John
Bought by
Carnegie Thomas and Carnegie Delores
Home Financials for this Owner
Home Financials are based on the most recent Mortgage that was taken out on this home.
Original Mortgage
$106,000
Interest Rate
8.55%
Create a Home Valuation Report for This Property
The Home Valuation Report is an in-depth analysis detailing your home's value as well as a comparison with similar homes in the area
Home Values in the Area
Average Home Value in this Area
Purchase History
| Date | Buyer | Sale Price | Title Company |
|---|---|---|---|
| -- | -- | -- | |
| Carnegie Thomas | $118,000 | -- |
Source: Public Records
Mortgage History
| Date | Status | Borrower | Loan Amount |
|---|---|---|---|
| Previous Owner | Carnegie Thomas | $106,000 |
Source: Public Records
Tax History Compared to Growth
Tax History
| Year | Tax Paid | Tax Assessment Tax Assessment Total Assessment is a certain percentage of the fair market value that is determined by local assessors to be the total taxable value of land and additions on the property. | Land | Improvement |
|---|---|---|---|---|
| 2025 | $11,381 | $355,900 | $128,100 | $227,800 |
| 2024 | $11,381 | $355,900 | $128,100 | $227,800 |
| 2022 | $11,146 | $355,900 | $128,100 | $227,800 |
| 2021 | $10,936 | $355,900 | $128,100 | $227,800 |
| 2020 | $10,765 | $355,900 | $128,100 | $227,800 |
| 2019 | $9,054 | $233,700 | $112,000 | $121,700 |
| 2018 | $9,014 | $233,700 | $112,000 | $121,700 |
| 2017 | $8,874 | $233,700 | $112,000 | $121,700 |
| 2016 | $8,771 | $233,700 | $112,000 | $121,700 |
| 2015 | $8,689 | $233,700 | $112,000 | $121,700 |
| 2014 | $8,525 | $233,700 | $112,000 | $121,700 |
Source: Public Records
Map
Nearby Homes
- 15 Martin St
- 66 Broughton Ave
- 267 Hoover Ave
- 40 Brighton Ave
- 211 E Passaic Ave
- 298 Hoover Ave Unit 28
- 170 Pake St
- 322 Hoover Ave Unit 73
- 149 E Passaic Ave
- 328-330 Hoover Ave
- 328 Hoover Ave
- 352 Hoover Ave Unit 94
- 366 Hoover Ave Unit 119
- 366 Hoover Ave Unit 118
- 109 Wilson St
- 156 Margaret Ave
- 73 Hoover Ave