26 Mason Dr Columbus, GA 31903
South Columbus NeighborhoodEstimated Value: $3,194,542
About This Home
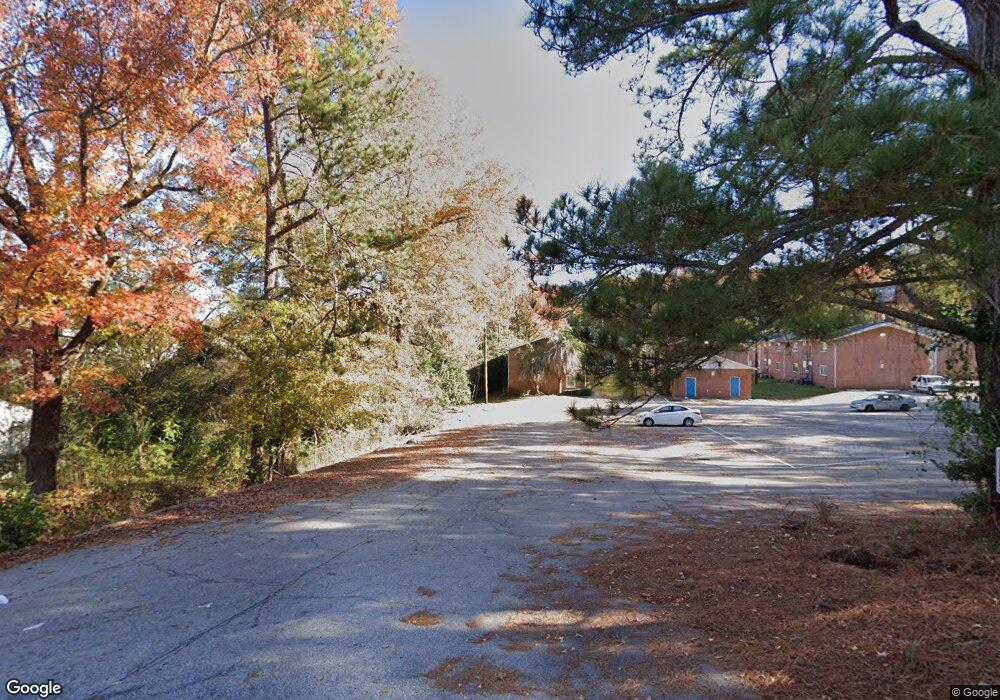
Surrounded by wooded views and mature landscaping, Mason Drive Apartments has quaint and cozy one bedroom apartment homes with various interior appointments. Convenience and location are just a couple of features this community can offer. Minutes away from downtown Columbus, shopping and dining, Mason Drive is close to it all yet tucked away from the hustle and bustle of city life!
Ownership History
We collect this data history from publicly available records. To have your information removed, we recommend requesting removal directly through your county’s website.
Purchase Details
Home Financials for this Owner
Home Financials are based on the most recent Mortgage that was taken out on this home.Purchase Details
Home Financials for this Owner
Home Financials are based on the most recent Mortgage that was taken out on this home.Purchase Details
Home Financials for this Owner
Home Financials are based on the most recent Mortgage that was taken out on this home.Home Values in the Area
Average Home Value in this Area
Purchase History
We collect this data history from publicly available records. To have your information removed, we recommend requesting removal directly through your county’s website.
| Date | Buyer | Sale Price | Title Company |
|---|---|---|---|
| -- | None Listed On Document | ||
| $2,300,000 | -- | ||
| $625,000 | -- |
Mortgage History
We collect this data history from publicly available records. To have your information removed, we recommend requesting removal directly through your county’s website.
| Date | Status | Borrower | Loan Amount |
|---|---|---|---|
| Open | $18,350,000 | ||
| Previous Owner | $9,500,000 | ||
| Previous Owner | $695,735 |
Property History
We collect this data history from publicly available records. To have your information removed, we recommend requesting removal directly through your county’s website.
| Date | Event | Price | List to Sale | Price per Sq Ft |
|---|---|---|---|---|
| 11/04/2024 11/04/24 | Off Market | $679 | -- | -- |
| 08/08/2023 08/08/23 | For Rent | $679 | 0.0% | -- |
| 07/13/2023 07/13/23 | For Rent | $679 | 0.0% | -- |
| 06/06/2023 06/06/23 | Price Changed | $679 | 0.0% | $1 / Sq Ft |
| 04/18/2023 04/18/23 | Price Changed | $679 | +2.9% | $1 / Sq Ft |
| 06/07/2022 06/07/22 | For Rent | $660 | 0.0% | -- |
| 05/18/2022 05/18/22 | For Rent | $660 | -- | -- |
Tax History
We collect this data history from publicly available records. To have your information removed, we recommend requesting removal directly through your county’s website.
| Year | Tax Paid | Tax Assessment Tax Assessment Total Assessment is a certain percentage of the fair market value that is determined by local assessors to be the total taxable value of land and additions on the property. | Land | Improvement |
|---|---|---|---|---|
| 2025 | $39,715 | $1,014,562 | $80,708 | $933,854 |
| 2024 | $39,715 | $1,014,562 | $80,708 | $933,854 |
| 2023 | $56,435 | $1,432,680 | $80,708 | $1,351,972 |
| 2022 | $31,290 | $766,333 | $80,708 | $685,625 |
| 2021 | $31,290 | $766,333 | $80,708 | $685,625 |
| 2020 | $20,116 | $585,968 | $80,708 | $505,260 |
| 2019 | $18,006 | $439,477 | $60,532 | $378,945 |
| 2018 | $5,326 | $130,000 | $32,480 | $97,520 |
| 2017 | $10,275 | $250,000 | $62,500 | $187,500 |
| 2016 | $13,665 | $331,280 | $33,600 | $297,680 |
| 2015 | $5,473 | $331,280 | $33,600 | $297,680 |
| 2014 | $5,479 | $331,280 | $33,600 | $297,680 |
| 2013 | -- | $331,280 | $33,600 | $297,680 |
Map
Ask me questions while you tour the home.