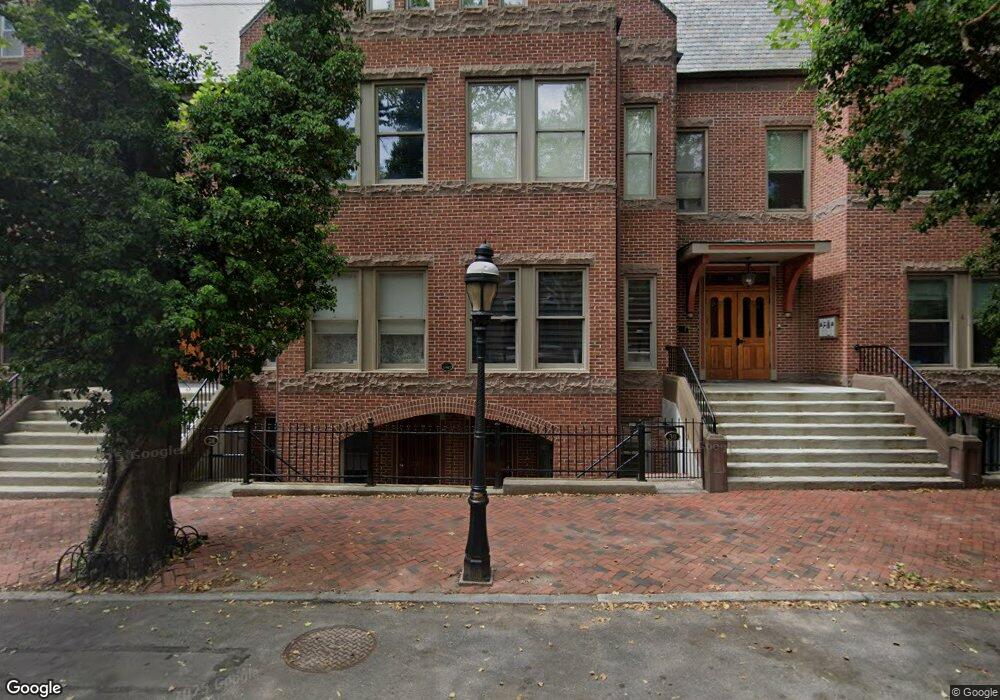
26 Mattoon St Unit 5 Springfield, MA 01105
Metro Center NeighborhoodEstimated Value: $108,000 - $301,000
2
Beds
3
Baths
1,536
Sq Ft
$139/Sq Ft
Est. Value
About This Home
This home is located at 26 Mattoon St Unit 5, Springfield, MA 01105 and is currently estimated at $213,724, approximately $139 per square foot. 26 Mattoon St Unit 5 is a home located in Hampden County with nearby schools including High School Of Commerce, Springfield High School of Science and Technology, and Roger L. Putnam Vocational Technical Academy.
Ownership History
Date
Name
Owned For
Owner Type
Purchase Details
Closed on
Dec 24, 2003
Sold by
Value Rt and Roy
Bought by
Williams Madeline V and Williams Thomas J
Current Estimated Value
Purchase Details
Closed on
Dec 23, 2003
Sold by
Beach Walrath J and Wells Fargo Assoc
Bought by
Rowe Frederick D
Purchase Details
Closed on
Feb 8, 1999
Sold by
Sanderling Rt and Hanmer Samuel R
Bought by
Beach Sr Walrath J
Home Financials for this Owner
Home Financials are based on the most recent Mortgage that was taken out on this home.
Original Mortgage
$54,600
Interest Rate
6.74%
Mortgage Type
Purchase Money Mortgage
Purchase Details
Closed on
Nov 12, 1996
Sold by
Steve Haddad & Co Inc
Bought by
Sanderling Rt and Hanmer Samuel R
Create a Home Valuation Report for This Property
The Home Valuation Report is an in-depth analysis detailing your home's value as well as a comparison with similar homes in the area
Home Values in the Area
Average Home Value in this Area
Purchase History
| Date | Buyer | Sale Price | Title Company |
|---|---|---|---|
| Williams Madeline V | -- | -- | |
| Williams Madeline V | -- | -- | |
| Rowe Frederick D | $77,000 | -- | |
| Value Rt | -- | -- | |
| Value Rt | -- | -- | |
| Beach Sr Walrath J | $78,000 | -- | |
| Beach Walrath J | $78,000 | -- | |
| Sanderling Rt | $96,000 | -- |
Source: Public Records
Mortgage History
| Date | Status | Borrower | Loan Amount |
|---|---|---|---|
| Previous Owner | Sanderling Rt | $54,600 | |
| Previous Owner | Sanderling Rt | $25,000 |
Source: Public Records
Tax History
| Year | Tax Paid | Tax Assessment Tax Assessment Total Assessment is a certain percentage of the fair market value that is determined by local assessors to be the total taxable value of land and additions on the property. | Land | Improvement |
|---|---|---|---|---|
| 2025 | $3,644 | $232,400 | $0 | $232,400 |
| 2024 | $3,498 | $217,800 | $0 | $217,800 |
| 2023 | $3,372 | $197,800 | $0 | $197,800 |
| 2022 | $3,472 | $184,500 | $0 | $184,500 |
| 2021 | $3,362 | $177,900 | $0 | $177,900 |
| 2020 | $3,379 | $173,000 | $0 | $173,000 |
| 2019 | $2,529 | $128,500 | $0 | $128,500 |
| 2018 | $2,529 | $128,500 | $0 | $128,500 |
| 2017 | $2,487 | $126,500 | $0 | $126,500 |
| 2016 | $2,487 | $126,500 | $0 | $126,500 |
| 2015 | $2,408 | $122,400 | $0 | $122,400 |
Source: Public Records
Map
Nearby Homes
- 140 Chestnut St Unit 706
- 140 Chestnut St Unit 702
- 140 Chestnut St Unit 204
- 140 Chestnut St Unit 819
- 140 Chestnut St Unit 619
- 140 Chestnut St Unit 816
- 140 Chestnut St Unit 604
- 140 Chestnut St Unit 407
- 69 Winter St
- 0 Maple St
- 40 Byers St
- 52 Central St Unit 504
- 50 Central St Unit 504
- 82 Central St Unit 304
- 66 Central St Unit 404
- 64 Central St Unit 403
- 68 Central St Unit 405
- 14 Crane St
- 24 Adams St
- 138 Magazine St
- 26 Mattoon St Unit 8
- 26 Mattoon St Unit 7
- 26 Mattoon St Unit 6
- 26 Mattoon St Unit 4
- 26 Mattoon St Unit 3
- 26 Mattoon St Unit 2
- 26 Mattoon St Unit 1
- 28.5 Mattoon St Unit 28 1/2
- 28.5 Mattoon St Unit 6
- 24 Mattoon St Unit 3
- 24 Mattoon St
- 24 Mattoon St Unit 1
- 24 Mattoon St Unit 1st floor
- 24 Mattoon St Unit 2
- 32 Mattoon St Unit 4
- 26 1/2 Mattoon St
- 26 Mattoon St Unit 3
- 28 Mattoon St Unit 28
- 28 1/2 Mattoon St Unit 28 1/2
- 28 1/2 Mattoon St Unit 6
Your Personal Tour Guide
Ask me questions while you tour the home.