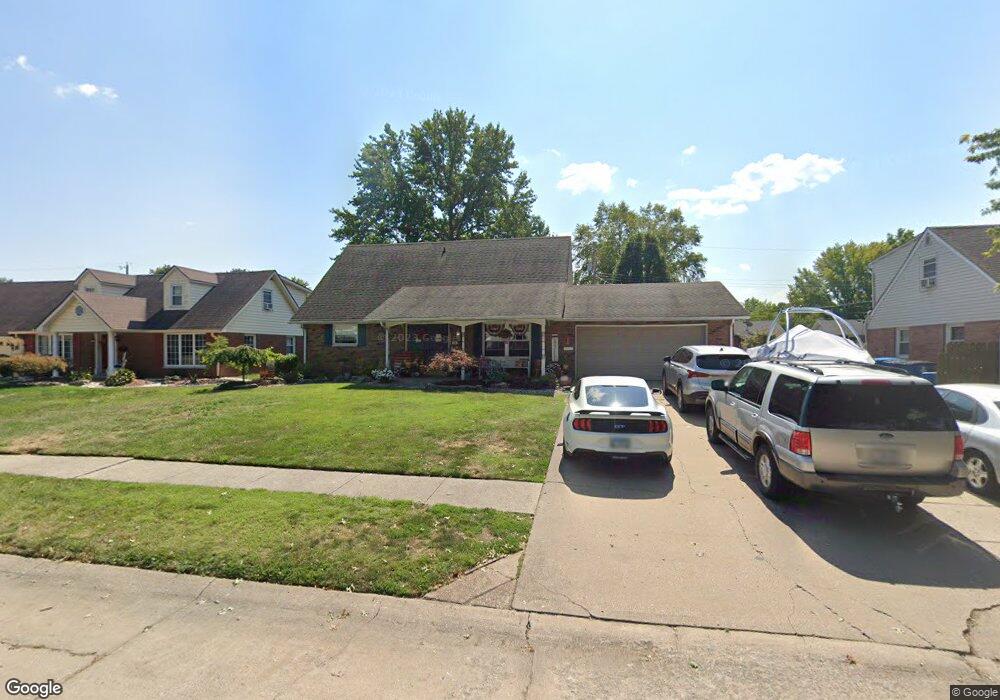
26 Miami Ct Granite City, IL 62040
Estimated Value: $179,000 - $208,000
3
Beds
2
Baths
1,152
Sq Ft
$167/Sq Ft
Est. Value
About This Home
This home is located at 26 Miami Ct, Granite City, IL 62040 and is currently estimated at $192,535, approximately $167 per square foot. 26 Miami Ct is a home located in Madison County with nearby schools including Granite City High School, St. Elizabeth Elementary School, and Metro East Montessori School.
Ownership History
Date
Name
Owned For
Owner Type
Purchase Details
Closed on
Feb 8, 2016
Sold by
James Douglas and James Evangeline
Bought by
James Douglas E and James Evangeline G
Current Estimated Value
Purchase Details
Closed on
Jul 15, 2004
Sold by
Schnefke Donald J and Schnefke Melanie L
Bought by
James Douglas and James Evangeline
Home Financials for this Owner
Home Financials are based on the most recent Mortgage that was taken out on this home.
Original Mortgage
$106,650
Outstanding Balance
$53,977
Interest Rate
6.42%
Mortgage Type
Purchase Money Mortgage
Estimated Equity
$138,558
Create a Home Valuation Report for This Property
The Home Valuation Report is an in-depth analysis detailing your home's value as well as a comparison with similar homes in the area
Home Values in the Area
Average Home Value in this Area
Purchase History
| Date | Buyer | Sale Price | Title Company |
|---|---|---|---|
| James Douglas E | -- | Snp Title Co | |
| James Douglas | $133,500 | Pontoon Title Co |
Source: Public Records
Mortgage History
| Date | Status | Borrower | Loan Amount |
|---|---|---|---|
| Open | James Douglas | $106,650 |
Source: Public Records
Tax History Compared to Growth
Tax History
| Year | Tax Paid | Tax Assessment Tax Assessment Total Assessment is a certain percentage of the fair market value that is determined by local assessors to be the total taxable value of land and additions on the property. | Land | Improvement |
|---|---|---|---|---|
| 2024 | $4,979 | $63,130 | $7,840 | $55,290 |
| 2023 | $4,979 | $56,900 | $7,070 | $49,830 |
| 2022 | $4,847 | $52,140 | $6,480 | $45,660 |
| 2021 | $4,437 | $48,900 | $6,080 | $42,820 |
| 2020 | $4,305 | $46,700 | $5,810 | $40,890 |
| 2019 | $4,147 | $44,270 | $5,510 | $38,760 |
| 2018 | $4,029 | $42,980 | $5,350 | $37,630 |
| 2017 | $3,953 | $44,570 | $5,550 | $39,020 |
| 2016 | $4,053 | $44,570 | $5,550 | $39,020 |
| 2015 | $3,655 | $44,570 | $5,550 | $39,020 |
| 2014 | $3,655 | $44,570 | $5,550 | $39,020 |
| 2013 | $3,655 | $44,570 | $5,550 | $39,020 |
Source: Public Records
Map
Nearby Homes