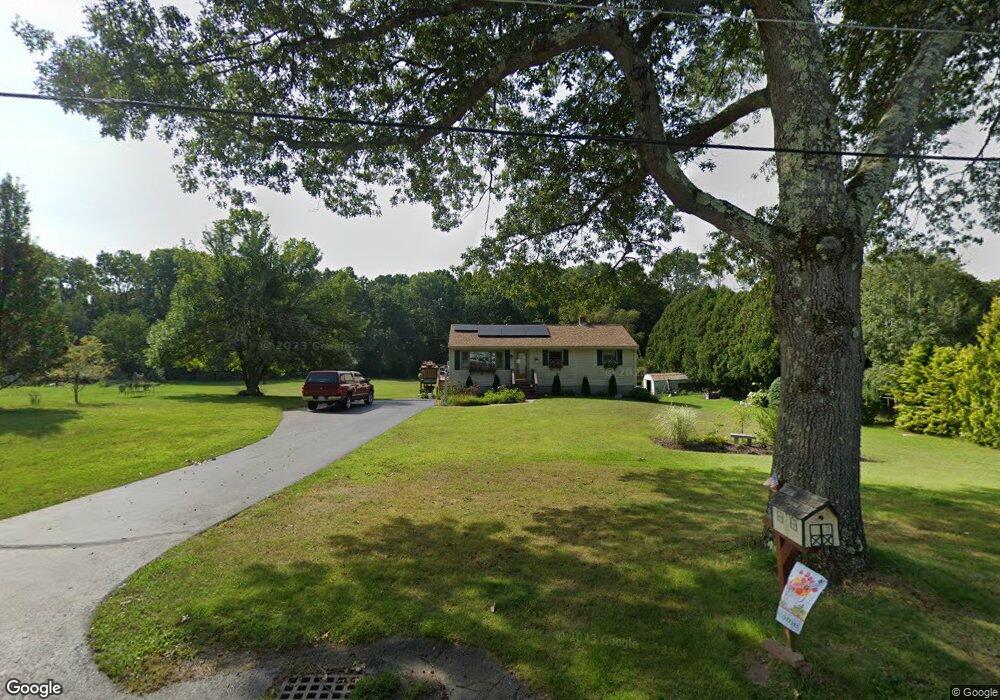
26 Mohawk St Bellingham, MA 02019
Estimated Value: $449,000 - $513,000
3
Beds
1
Bath
1,008
Sq Ft
$468/Sq Ft
Est. Value
About This Home
This home is located at 26 Mohawk St, Bellingham, MA 02019 and is currently estimated at $472,049, approximately $468 per square foot. 26 Mohawk St is a home located in Norfolk County with nearby schools including Joseph F. DiPietro Elementary, Bellingham High School, and Rise Prep Mayoral Academy Middle School.
Ownership History
Date
Name
Owned For
Owner Type
Purchase Details
Closed on
Mar 2, 2016
Sold by
Renaghan M June and Renaghan Albert M
Bought by
Renaghan Ret and Renaghan M June
Current Estimated Value
Purchase Details
Closed on
Nov 12, 1975
Bought by
Renaghan Ret
Create a Home Valuation Report for This Property
The Home Valuation Report is an in-depth analysis detailing your home's value as well as a comparison with similar homes in the area
Home Values in the Area
Average Home Value in this Area
Purchase History
| Date | Buyer | Sale Price | Title Company |
|---|---|---|---|
| Renaghan Ret | -- | -- | |
| Renaghan Ret | $30,000 | -- |
Source: Public Records
Mortgage History
| Date | Status | Borrower | Loan Amount |
|---|---|---|---|
| Previous Owner | Renaghan Ret | $150,000 | |
| Previous Owner | Renaghan Ret | $43,000 | |
| Previous Owner | Renaghan Ret | $20,000 |
Source: Public Records
Tax History
| Year | Tax Paid | Tax Assessment Tax Assessment Total Assessment is a certain percentage of the fair market value that is determined by local assessors to be the total taxable value of land and additions on the property. | Land | Improvement |
|---|---|---|---|---|
| 2025 | $4,925 | $392,100 | $171,300 | $220,800 |
| 2024 | $4,718 | $366,900 | $156,400 | $210,500 |
| 2023 | $4,547 | $348,400 | $148,900 | $199,500 |
| 2022 | $4,425 | $314,300 | $124,200 | $190,100 |
| 2021 | $4,310 | $299,100 | $124,200 | $174,900 |
| 2020 | $4,040 | $284,100 | $124,200 | $159,900 |
| 2019 | $3,949 | $277,900 | $124,200 | $153,700 |
| 2018 | $3,634 | $252,200 | $119,400 | $132,800 |
| 2017 | $3,535 | $246,500 | $119,400 | $127,100 |
| 2016 | $3,374 | $236,100 | $117,400 | $118,700 |
| 2015 | $3,235 | $227,000 | $112,900 | $114,100 |
| 2014 | $3,237 | $220,800 | $110,300 | $110,500 |
Source: Public Records
Map
Nearby Homes
- 11 Quail Run Rd
- 36 Indian Run Rd
- 4 Little Tree Ln
- 11 Bellingham Rd
- 49R Elm St
- 17 Susan Ln
- 0 North St Unit 73440626
- 183 Elm St Unit 185
- 70 Oswego St
- Lot 3 Pickering Rd
- Lot 2 Pickering Rd
- Lot 1 Pickering Rd
- Lot 5 Pickering Rd
- Lot 4 Pickering Rd
- 60 Freeman St
- 90 Pleasant St
- 22 Fox Run Rd
- 58 Douglas Dr
- 352 Lake St
- 21 Irving St
Your Personal Tour Guide
Ask me questions while you tour the home.