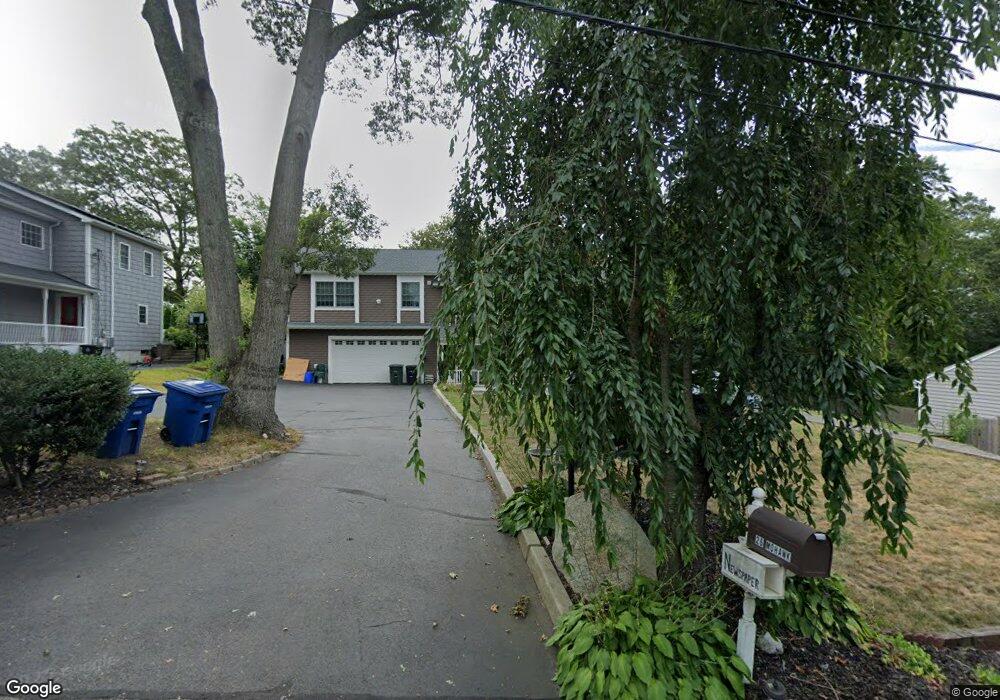
26 Mohawk St Coventry, RI 02816
Estimated Value: $413,000 - $668,000
4
Beds
2
Baths
1,919
Sq Ft
$277/Sq Ft
Est. Value
About This Home
This home is located at 26 Mohawk St, Coventry, RI 02816 and is currently estimated at $532,422, approximately $277 per square foot. 26 Mohawk St is a home located in Kent County with nearby schools including Alan Shawn Feinstein Ms Of Cov, Coventry High School, and Father John V. Doyle School.
Ownership History
Date
Name
Owned For
Owner Type
Purchase Details
Closed on
Nov 13, 2001
Sold by
Lancellotti Jean M and Lancellotti Stephen G
Bought by
Kenney Ii James H and Kenney Dawn M
Current Estimated Value
Purchase Details
Closed on
Jun 20, 2001
Sold by
Harlow William E
Bought by
Lancellotti Jean M and Lancelotti Stephen G
Purchase Details
Closed on
Dec 10, 1999
Sold by
Germond Walter M and Germond Martha M
Bought by
Harlow William E
Purchase Details
Closed on
Oct 19, 1994
Sold by
Harper Jack A and Harper Ann
Bought by
Germond Walter M
Purchase Details
Closed on
Oct 25, 1989
Sold by
Ray Joseph
Bought by
Harper Jack
Create a Home Valuation Report for This Property
The Home Valuation Report is an in-depth analysis detailing your home's value as well as a comparison with similar homes in the area
Purchase History
| Date | Buyer | Sale Price | Title Company |
|---|---|---|---|
| Kenney Ii James H | $155,000 | -- | |
| Lancellotti Jean M | $110,000 | -- | |
| Harlow William E | $113,000 | -- | |
| Germond Walter M | $85,000 | -- | |
| Harper Jack | $115,000 | -- |
Source: Public Records
Mortgage History
| Date | Status | Borrower | Loan Amount |
|---|---|---|---|
| Open | Harper Jack | $378,000 | |
| Closed | Harper Jack | $274,946 |
Source: Public Records
Tax History
| Year | Tax Paid | Tax Assessment Tax Assessment Total Assessment is a certain percentage of the fair market value that is determined by local assessors to be the total taxable value of land and additions on the property. | Land | Improvement |
|---|---|---|---|---|
| 2025 | $7,049 | $438,100 | $105,800 | $332,300 |
| 2024 | $6,940 | $438,100 | $105,800 | $332,300 |
| 2023 | $6,716 | $438,100 | $105,800 | $332,300 |
| 2022 | $6,830 | $349,000 | $100,400 | $248,600 |
| 2021 | $6,771 | $349,000 | $100,400 | $248,600 |
| 2020 | $7,762 | $349,000 | $100,400 | $248,600 |
| 2019 | $5,233 | $235,300 | $79,200 | $156,100 |
| 2018 | $5,085 | $235,300 | $79,200 | $156,100 |
| 2017 | $4,937 | $235,300 | $79,200 | $156,100 |
| 2016 | $4,344 | $202,900 | $63,400 | $139,500 |
| 2015 | $4,237 | $203,400 | $63,400 | $140,000 |
| 2014 | $3,273 | $188,200 | $63,400 | $124,800 |
| 2013 | $3,695 | $198,000 | $69,500 | $128,500 |
Source: Public Records
Map
Nearby Homes
- 22 Rawlinson Dr
- 21 Darton St
- 275 E Shore Dr
- 251 E Shore Dr
- 1 Pettine St
- 11 Kennedy Dr
- 22 Colorado St
- 20 Pine Way Blvd
- 19 Pine Way Blvd
- 311 Arnold Rd
- 45 Pine Ave Unit 36
- 91 Windsor Park Dr
- 10 Colonial Rd
- 0 New London Turnpike
- 4 York Dr
- 9 Holmes Rd
- 27 Matteson St
- 32 Pilgrim Ave
- 19 Turner Dr
- 86 Wood St
Your Personal Tour Guide
Ask me questions while you tour the home.